🎨 Plot Appearance & Accessibility
SounderPy provides several options for changing the presentation of sounding and hodograph figures without changing the underlying atmospheric profile.
In this tutorial you will:
retrieve one observed sounding;
compare light and dark plotting modes;
compare standard and color-deficiency-friendly sounding colors;
save figures and control output resolution;
combine appearance options;
reproduce the same workflow from the SounderPy CLI.
Using the same profile for each comparison makes it easier to see exactly what each plotting option changes.
Retrieve the Example Sounding
The examples use the OAX observed sounding from 16 June 2014 at 18 UTC.
import sounderpy as spy

data = spy.get_obs_data(
    "OAX",
    "2014",
    "06",
    "16",
    "18",
    hush=True,
)
Light and Dark Soundings
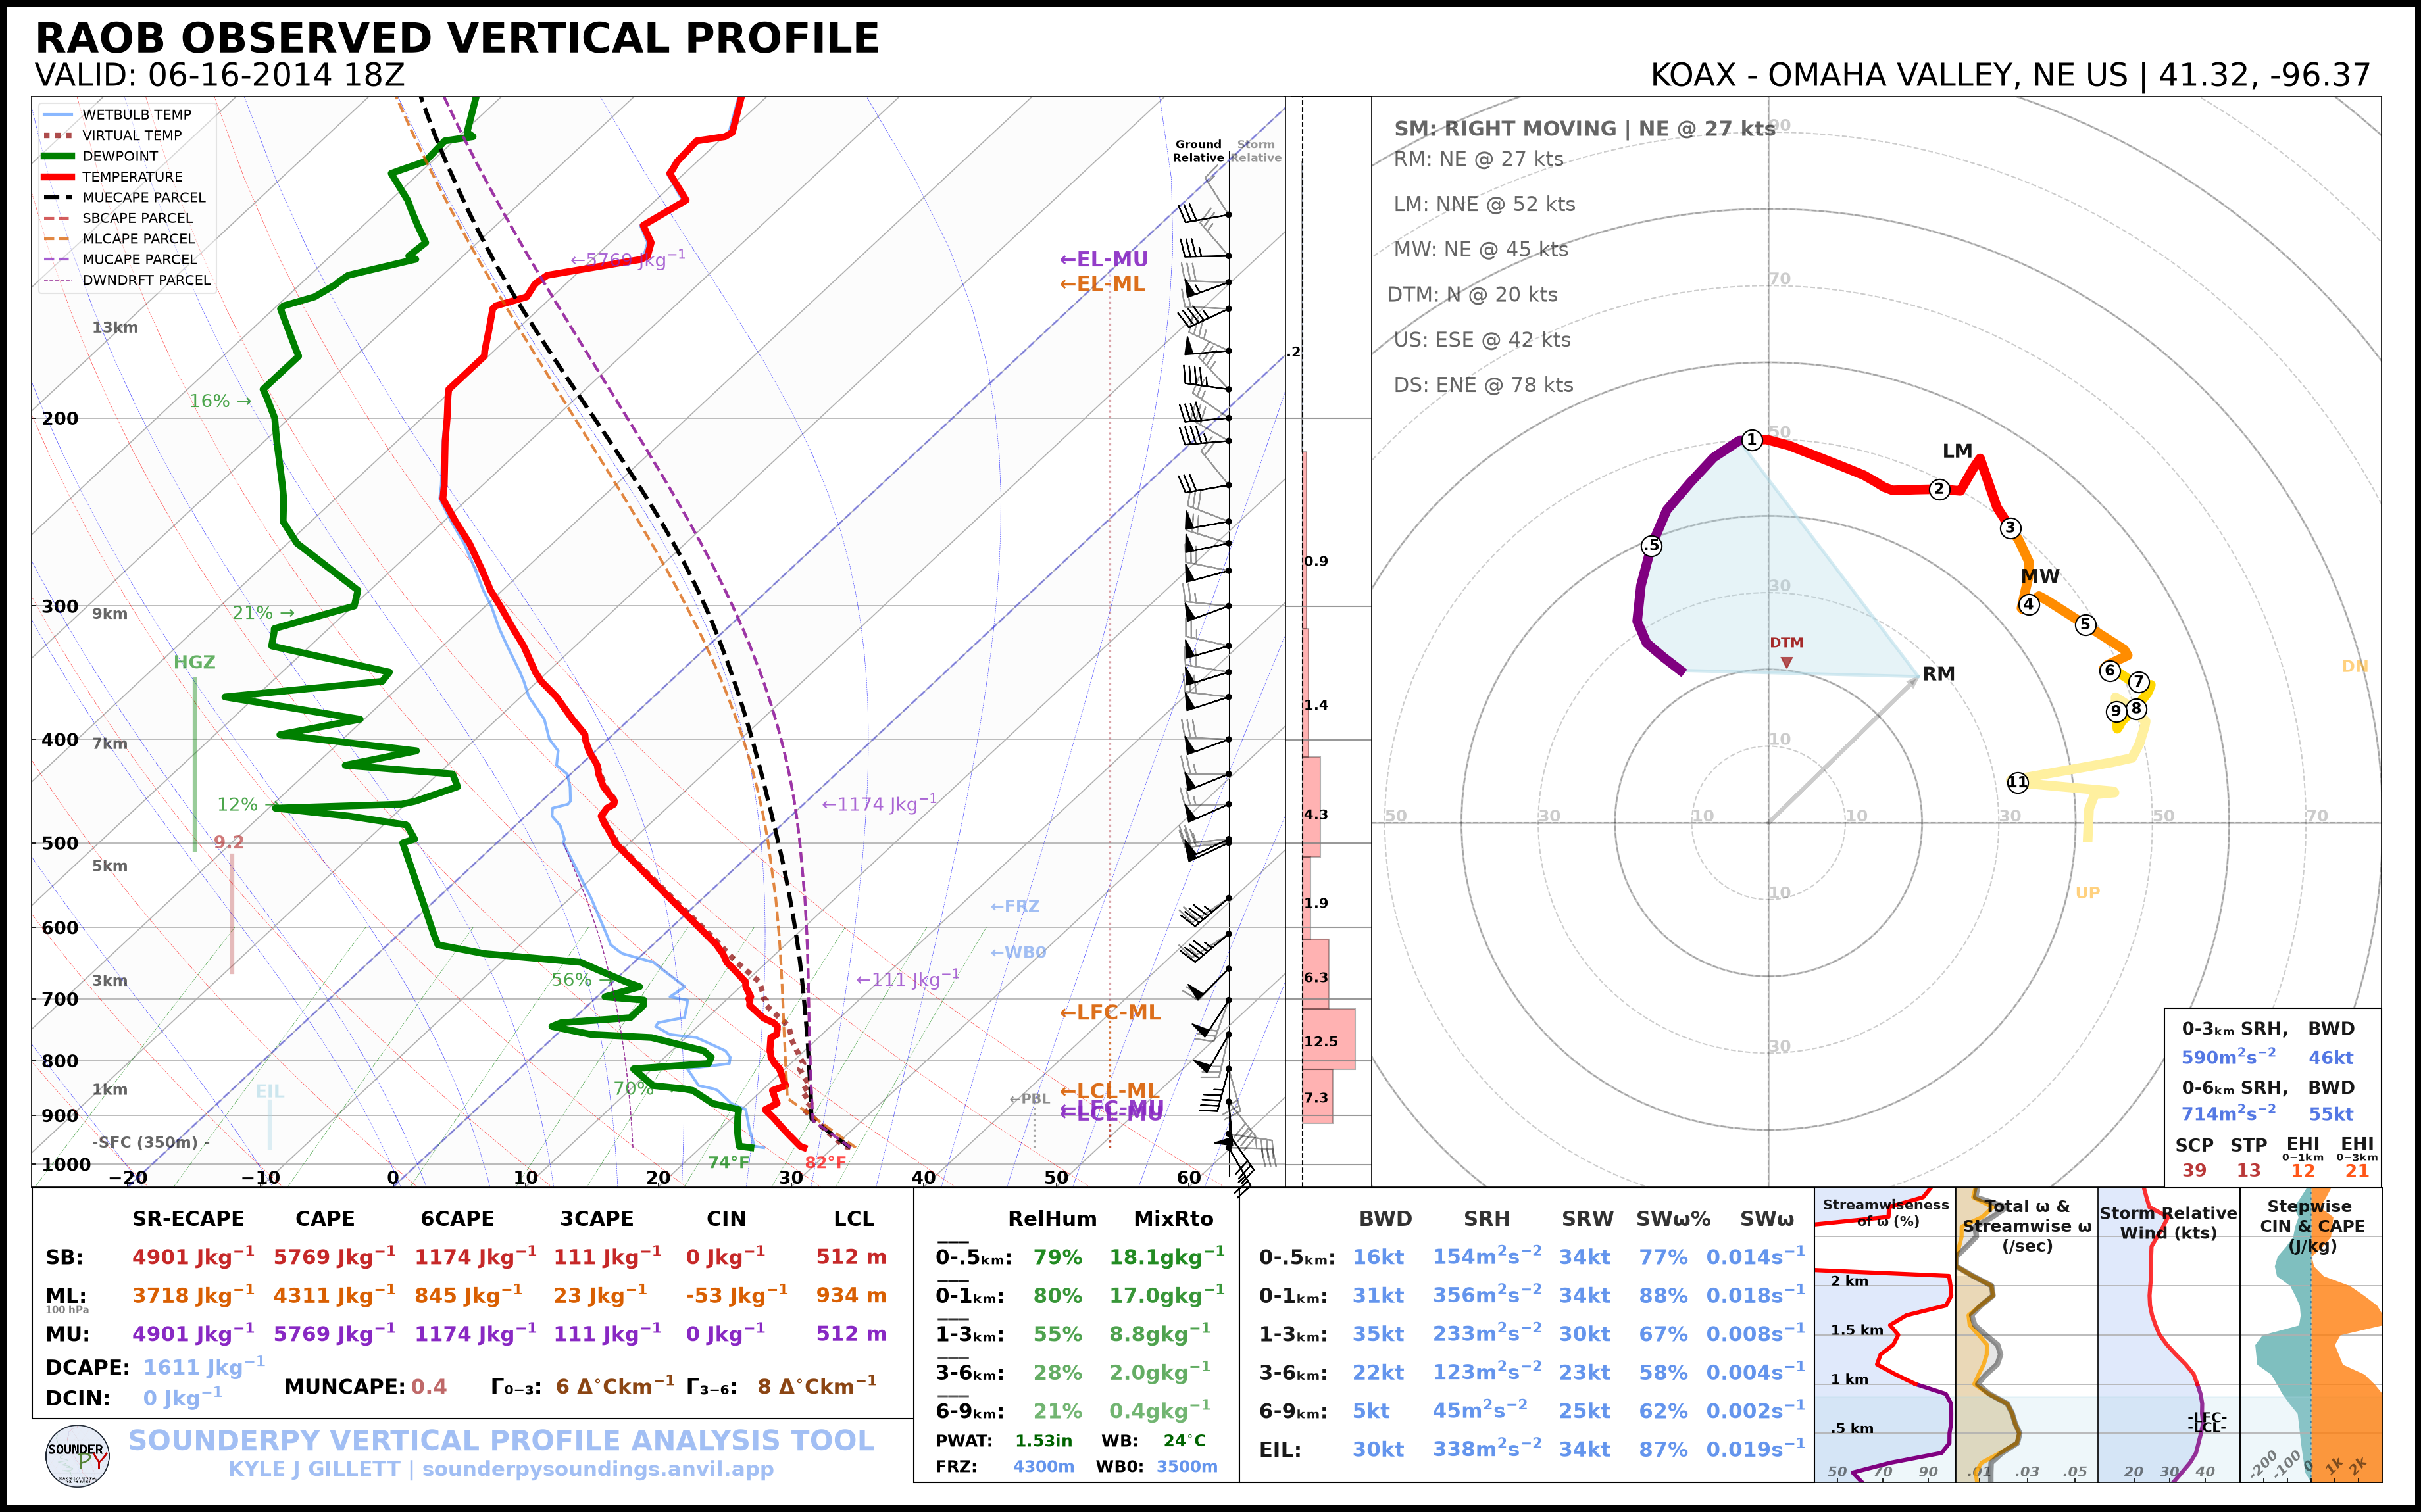
Light Mode
The default SounderPy plot uses a light background:
spy.build_sounding(
    data,
    dark_mode=False,
    radar=None,
    map_zoom=0,
)
Dark Mode
Set dark_mode=True to use the dark-background plotting theme:
spy.build_sounding(
    data,
    dark_mode=True,
    radar=None,
    map_zoom=0,
)
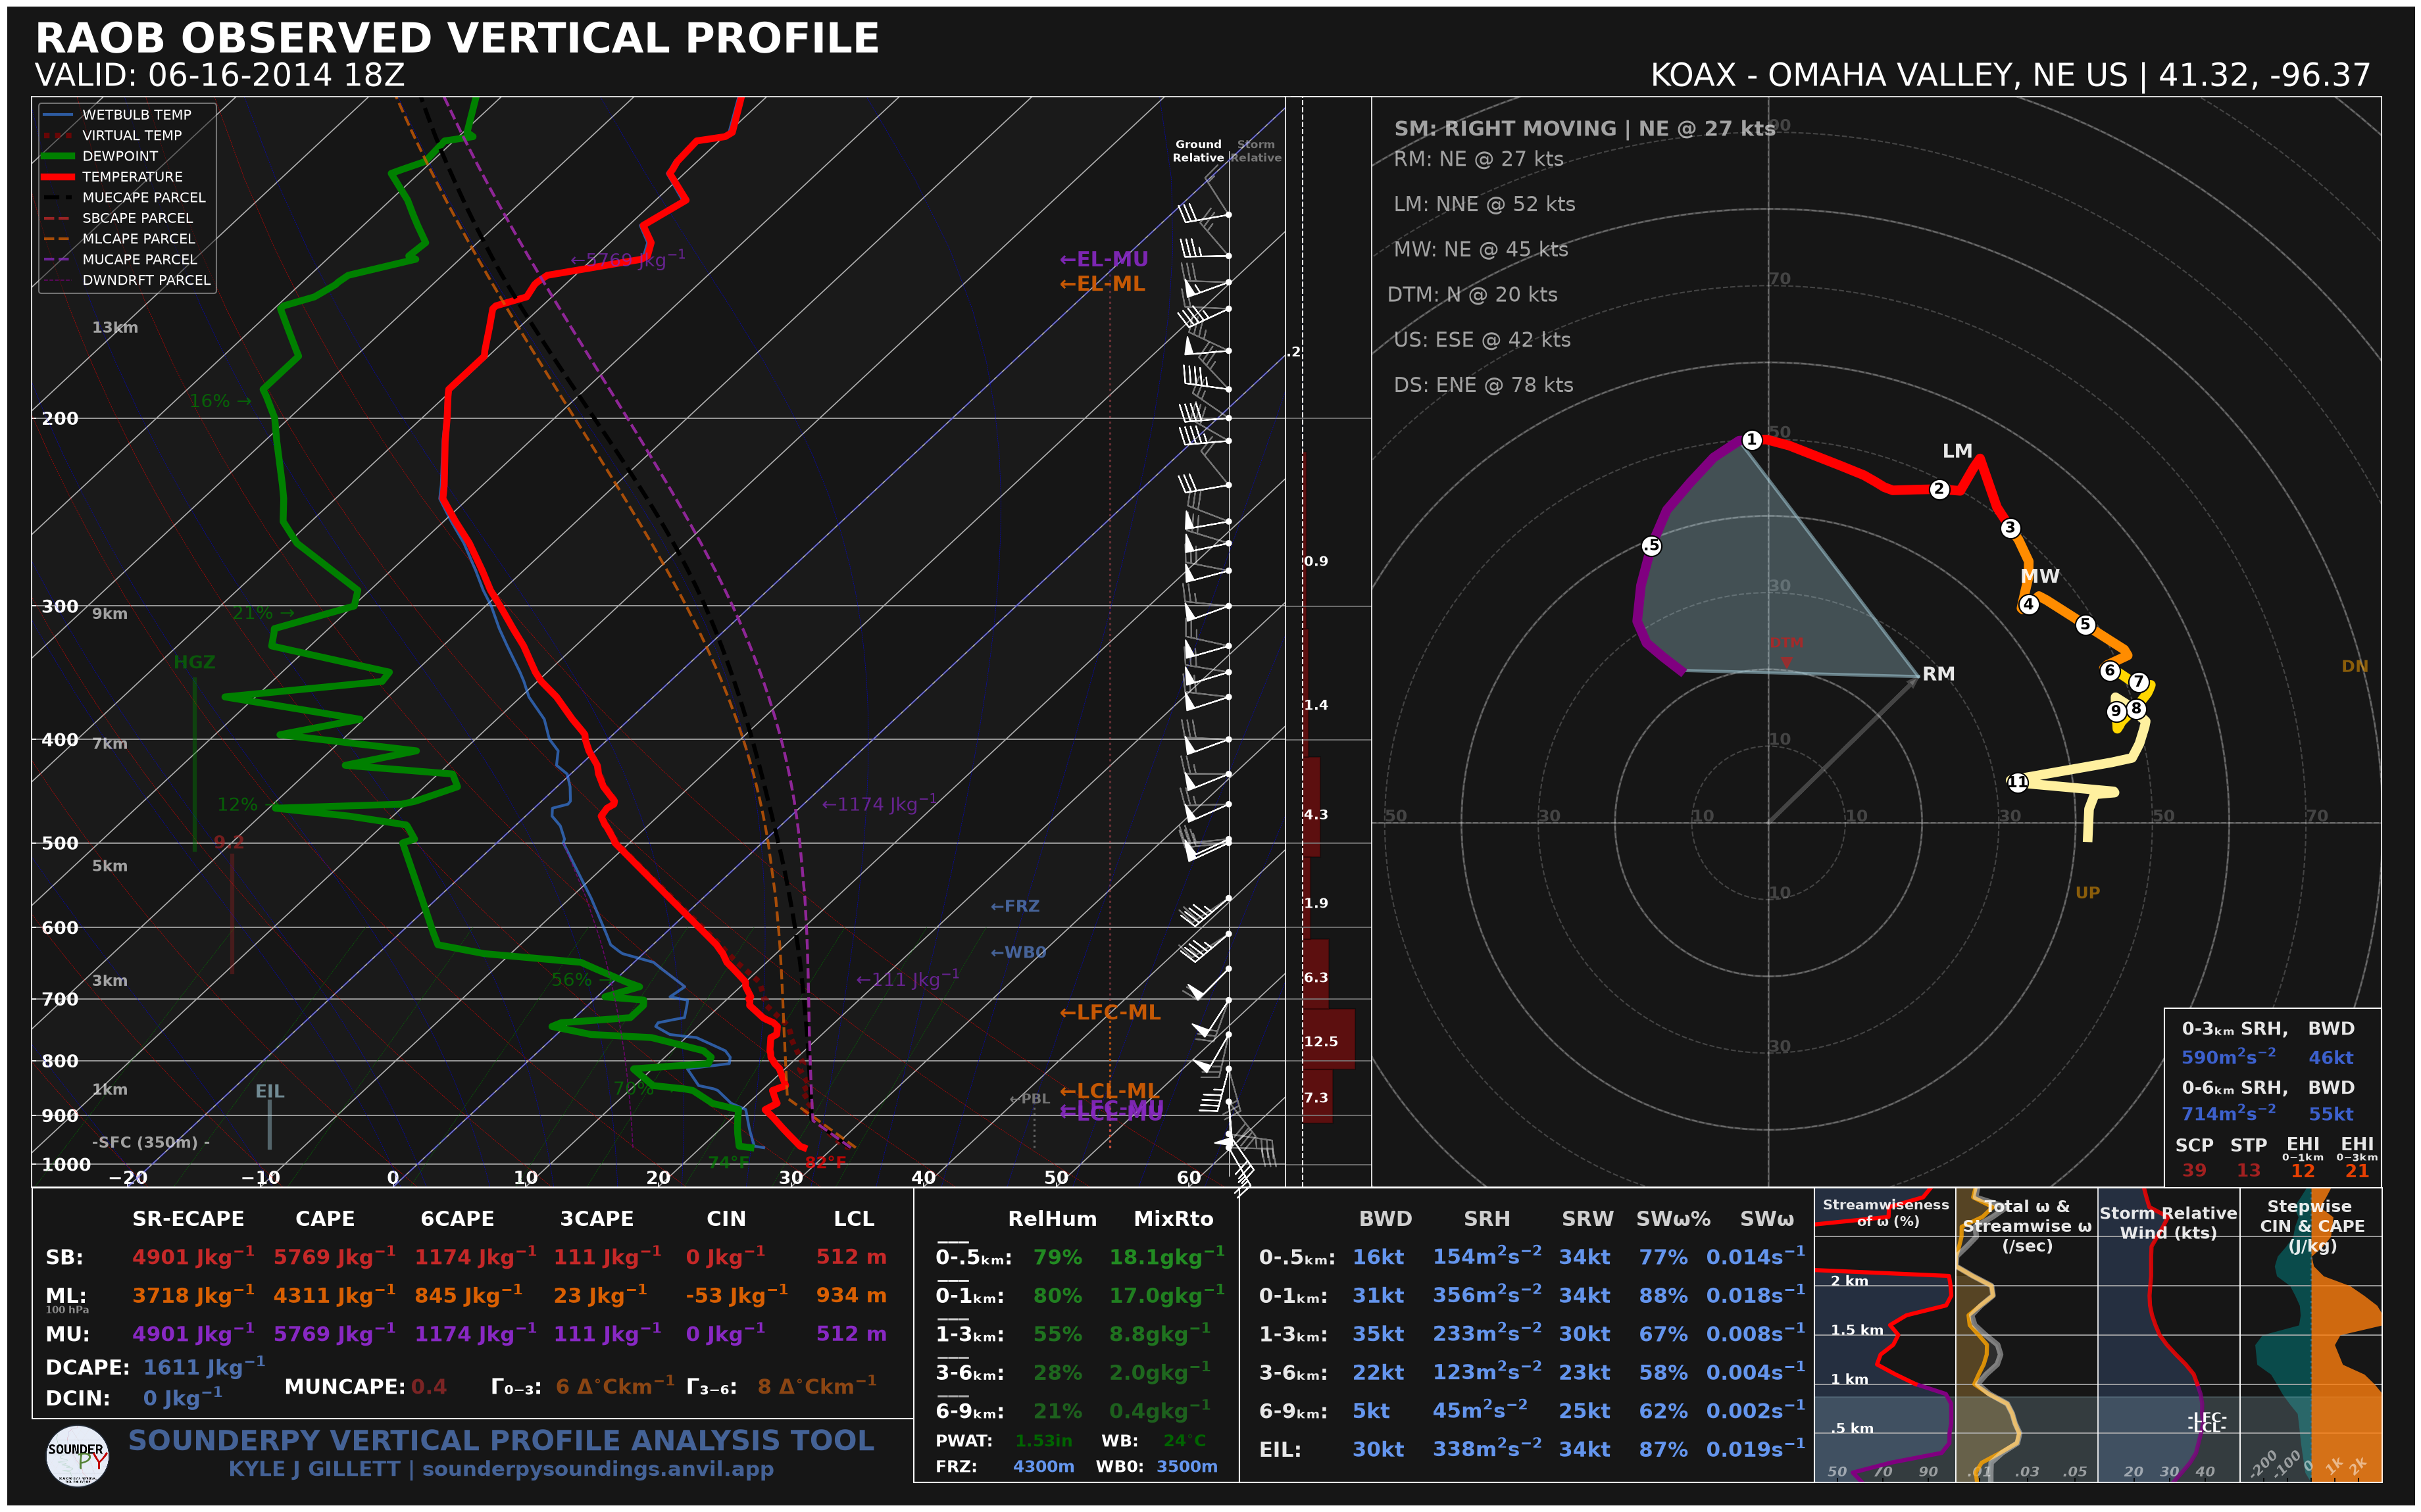
The profile data and parameter calculations are unchanged; only the presentation is different.
Light and Dark Hodographs
The same dark_mode argument is available for standalone hodographs.
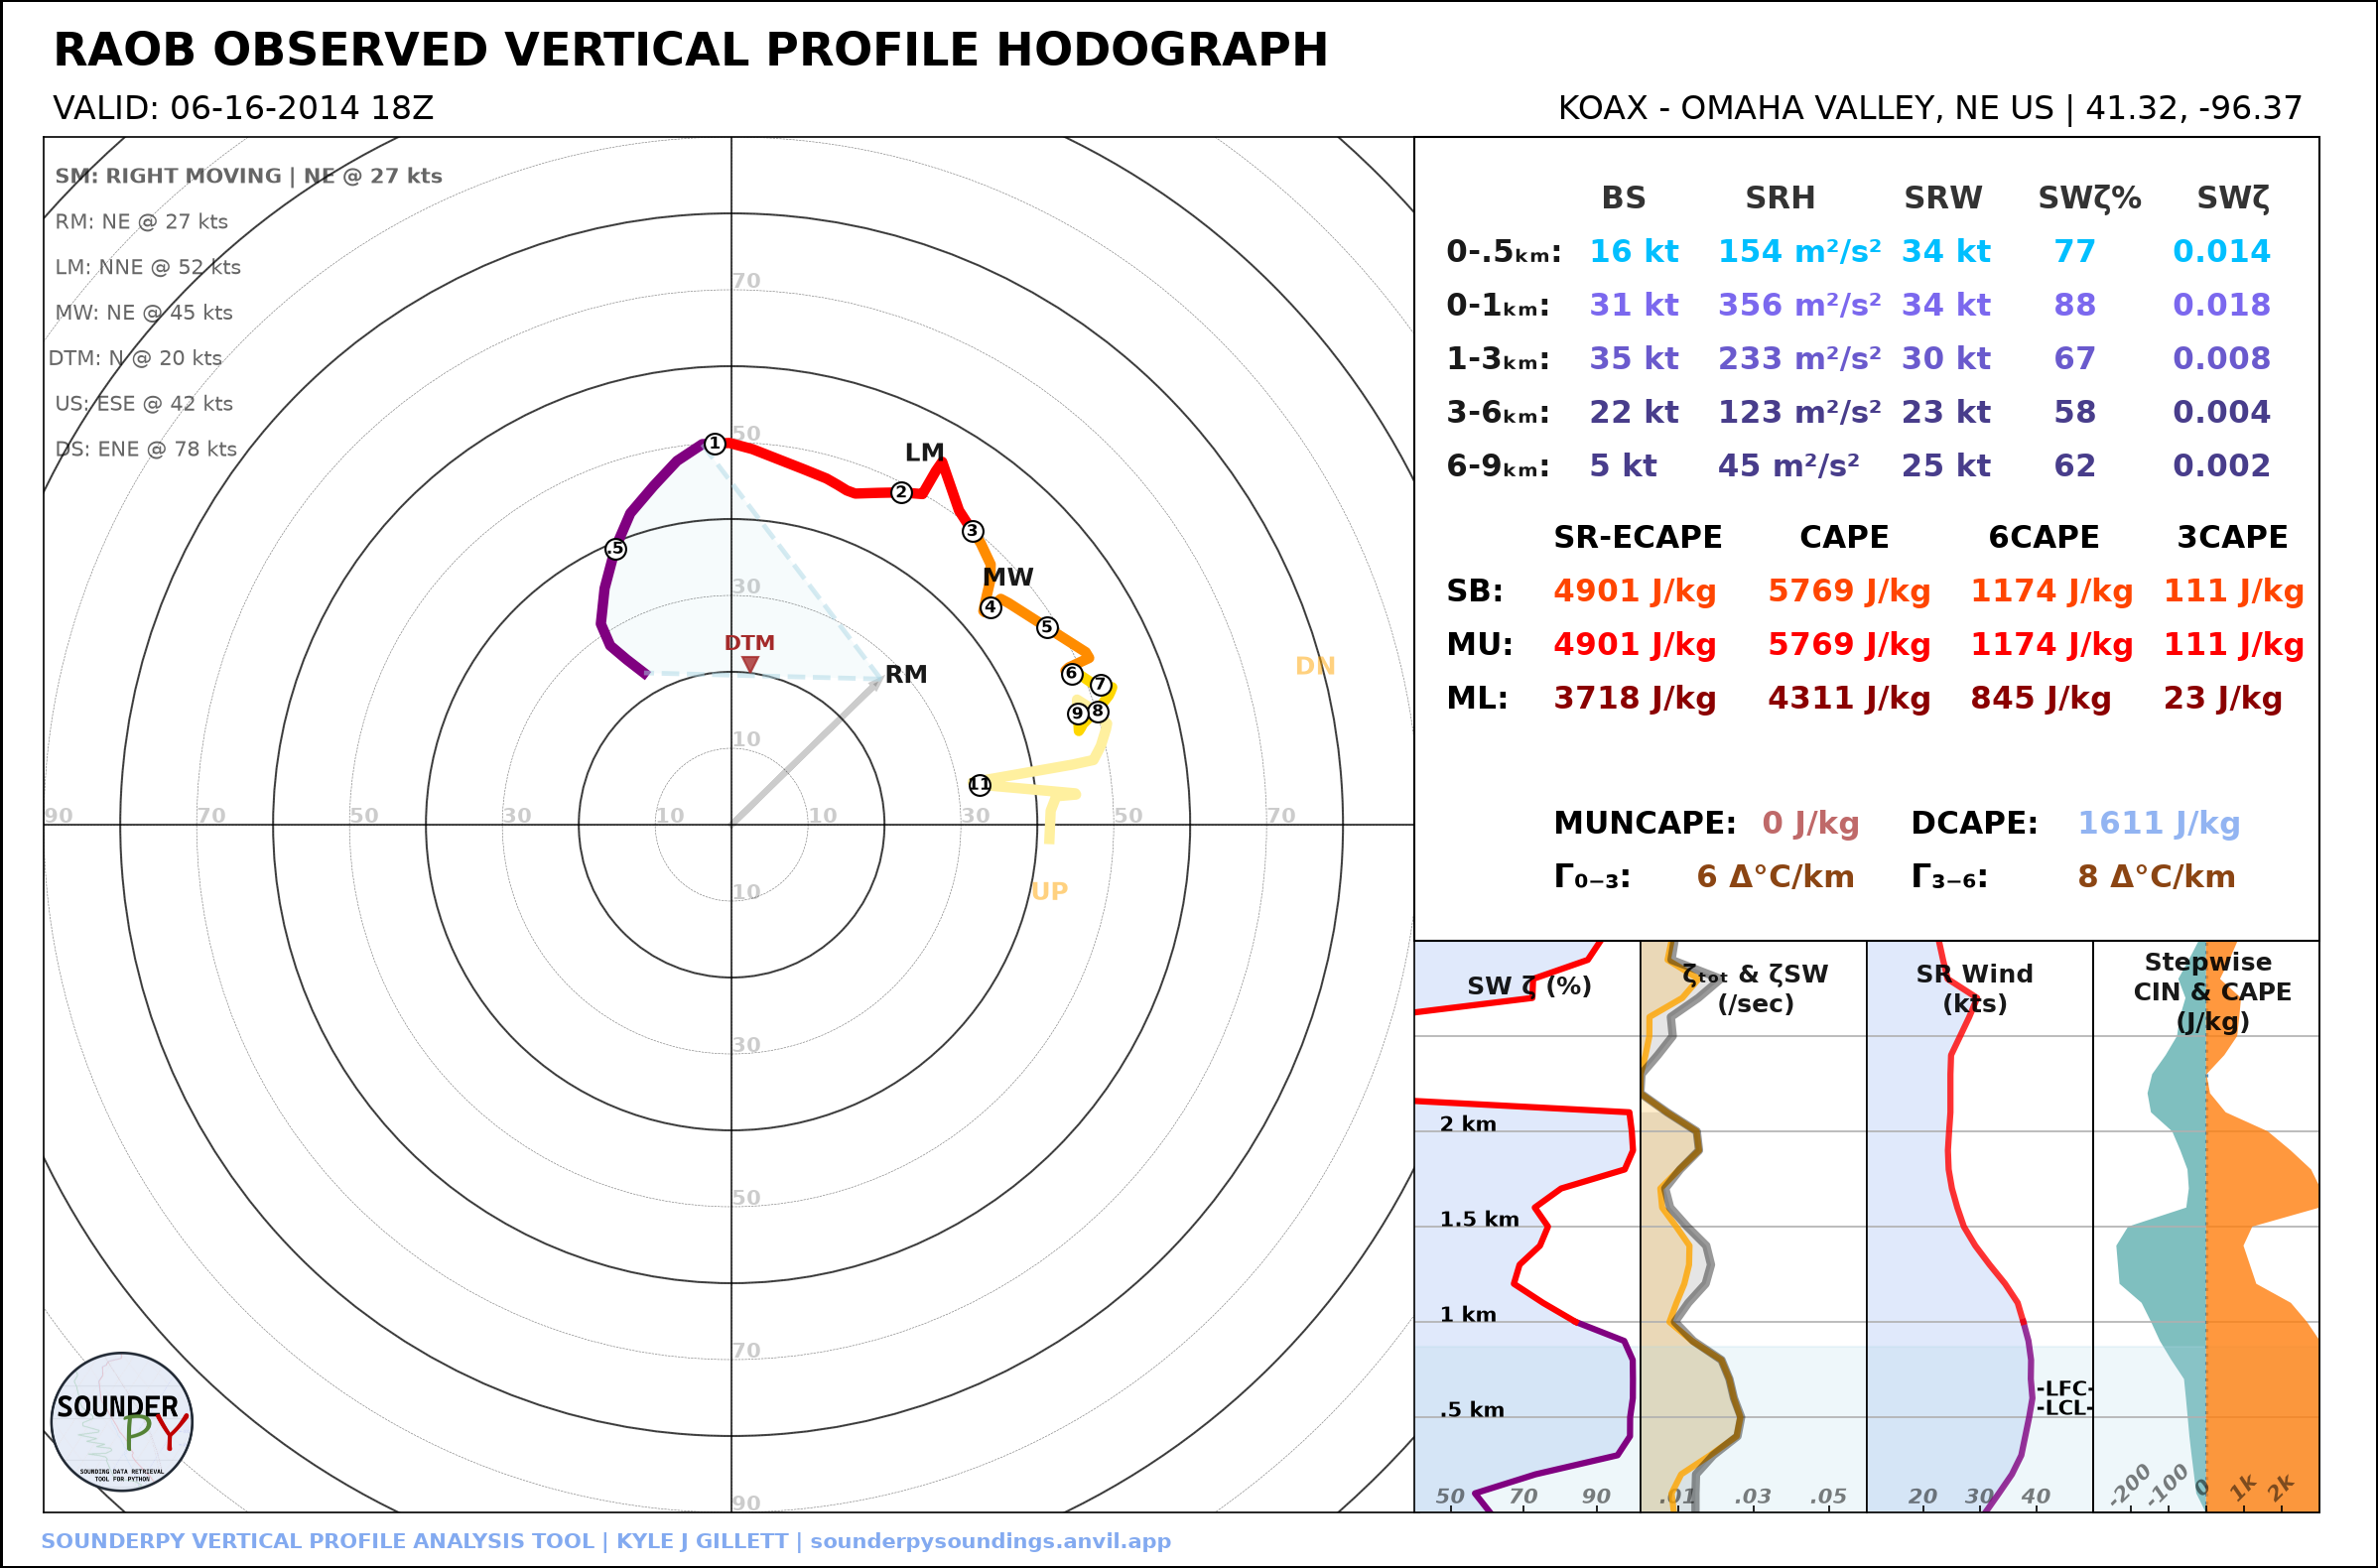
Light Mode |
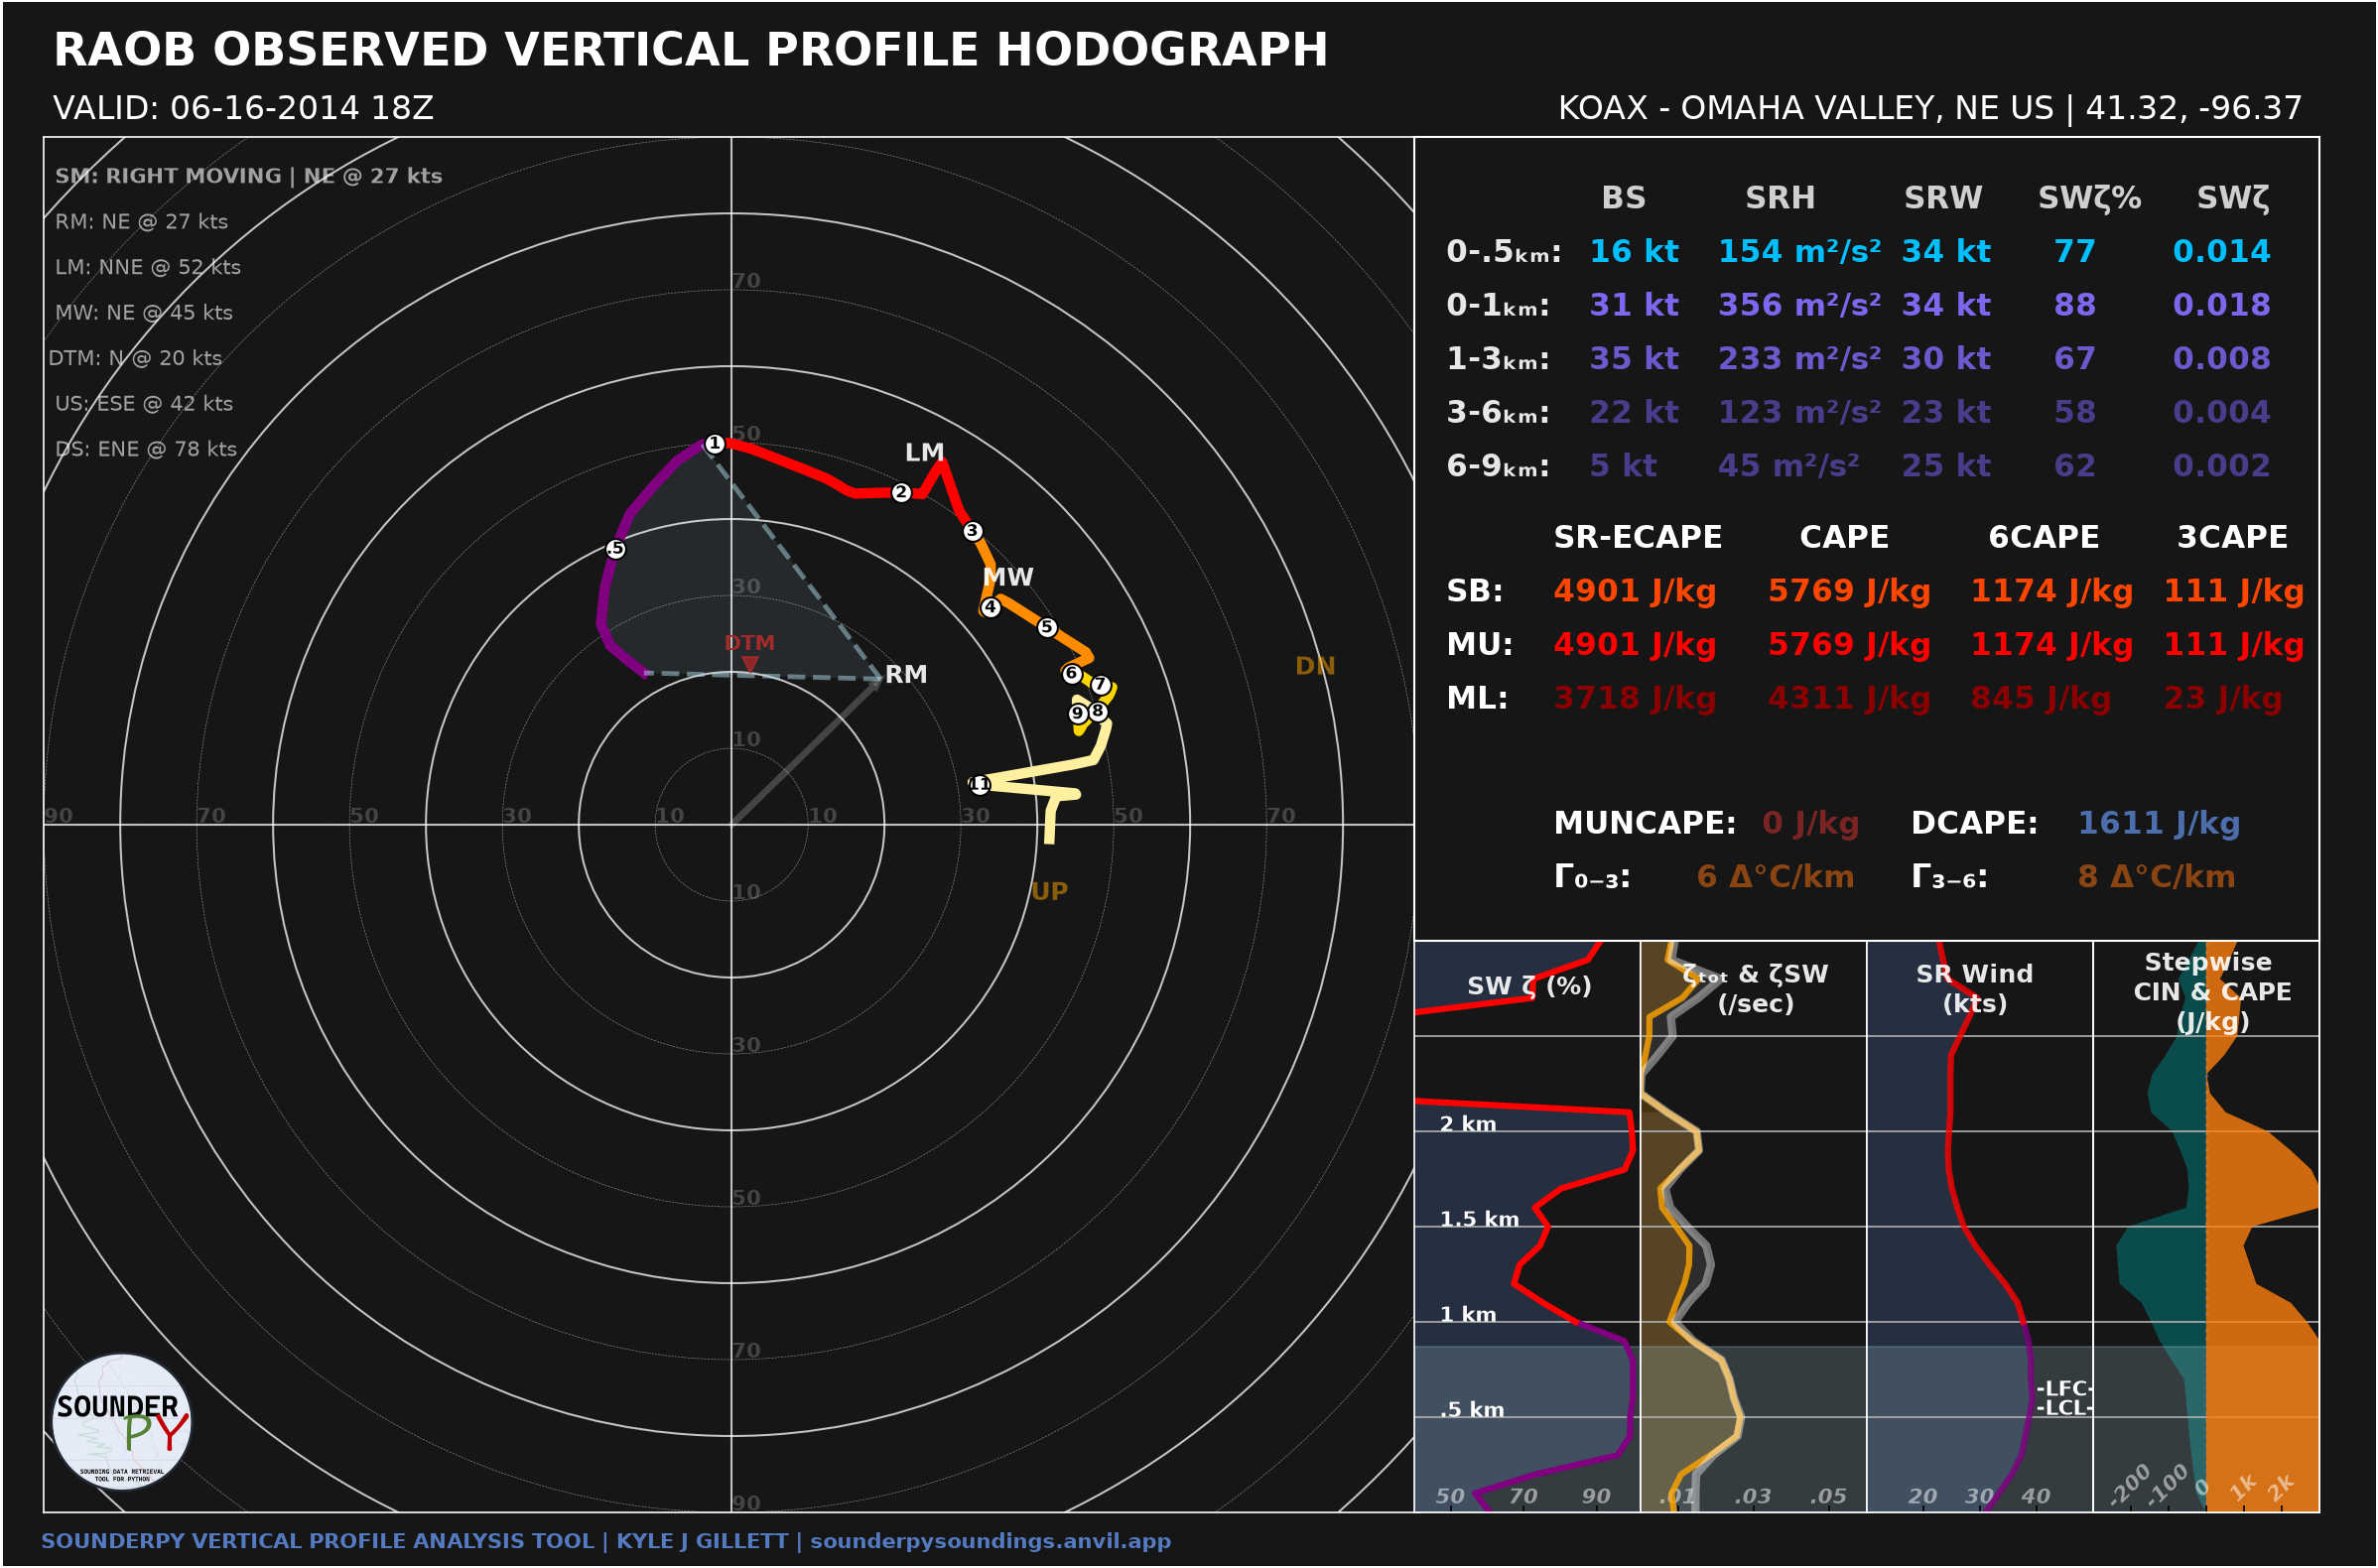
Dark Mode |
Create them with:
spy.build_hodograph(
    data,
    dark_mode=False,
    radar=None,
    map_zoom=0,
)

spy.build_hodograph(
    data,
    dark_mode=True,
    radar=None,
    map_zoom=0,
)
Color-Deficiency-Friendly Soundings
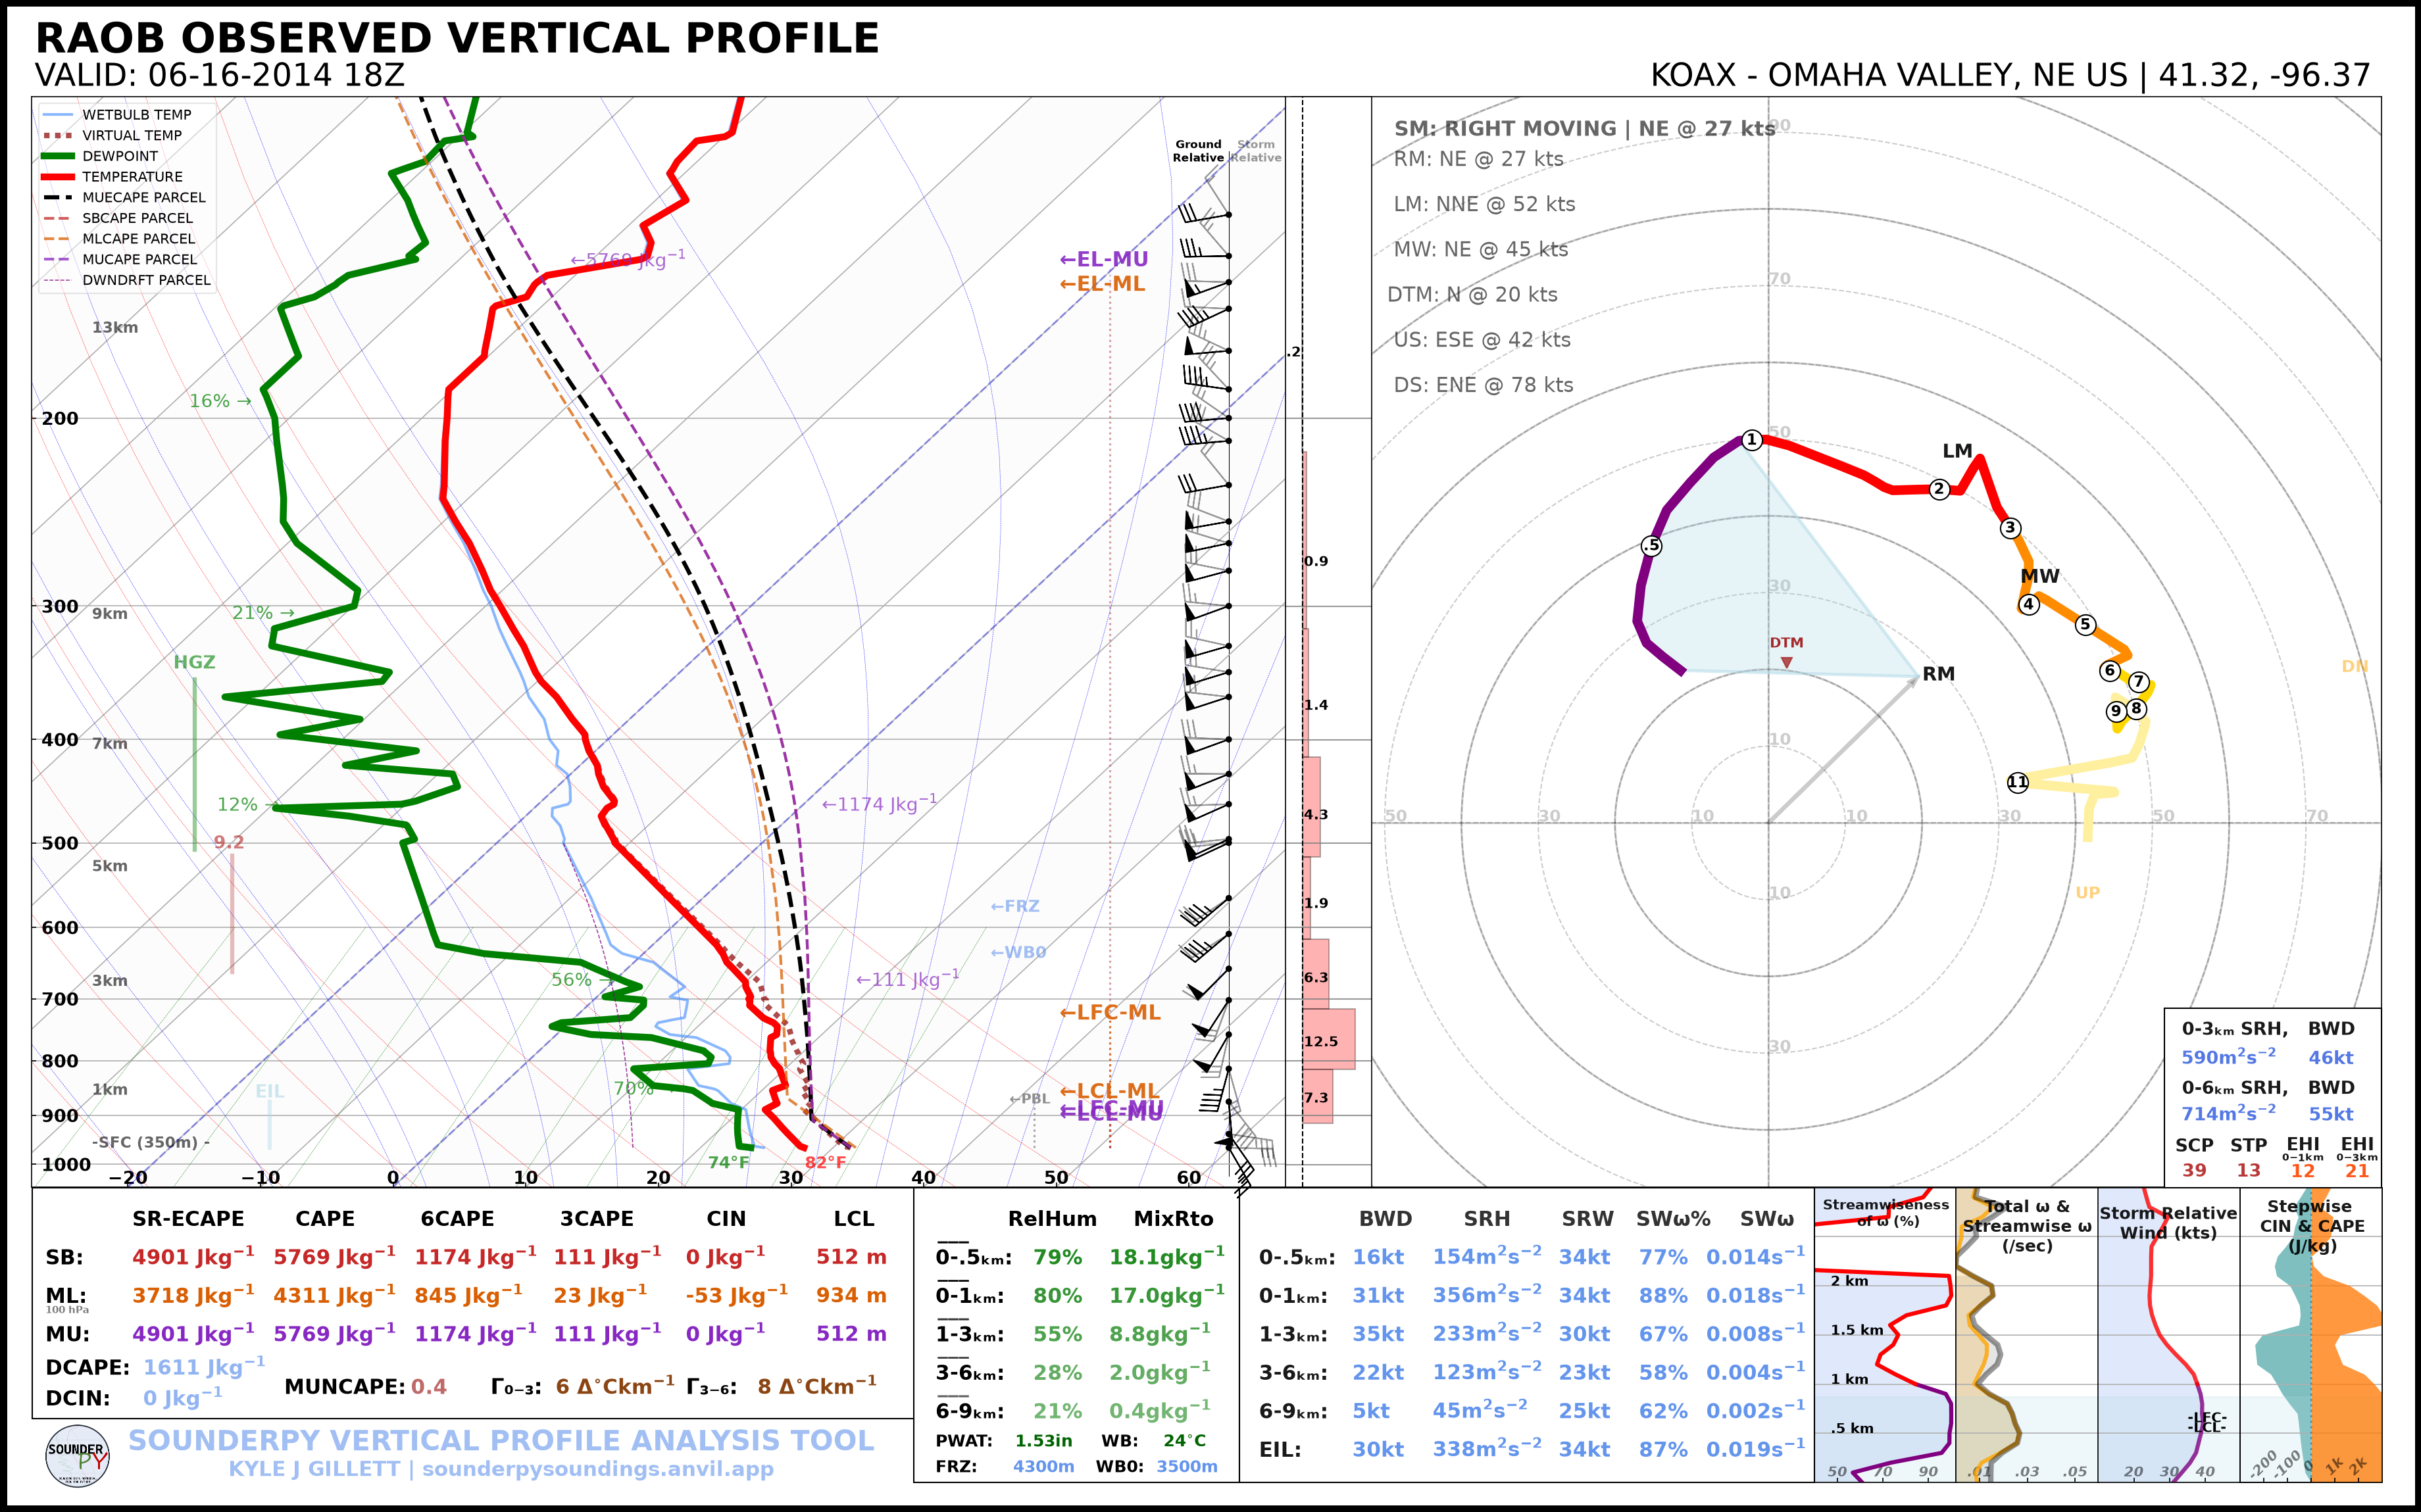
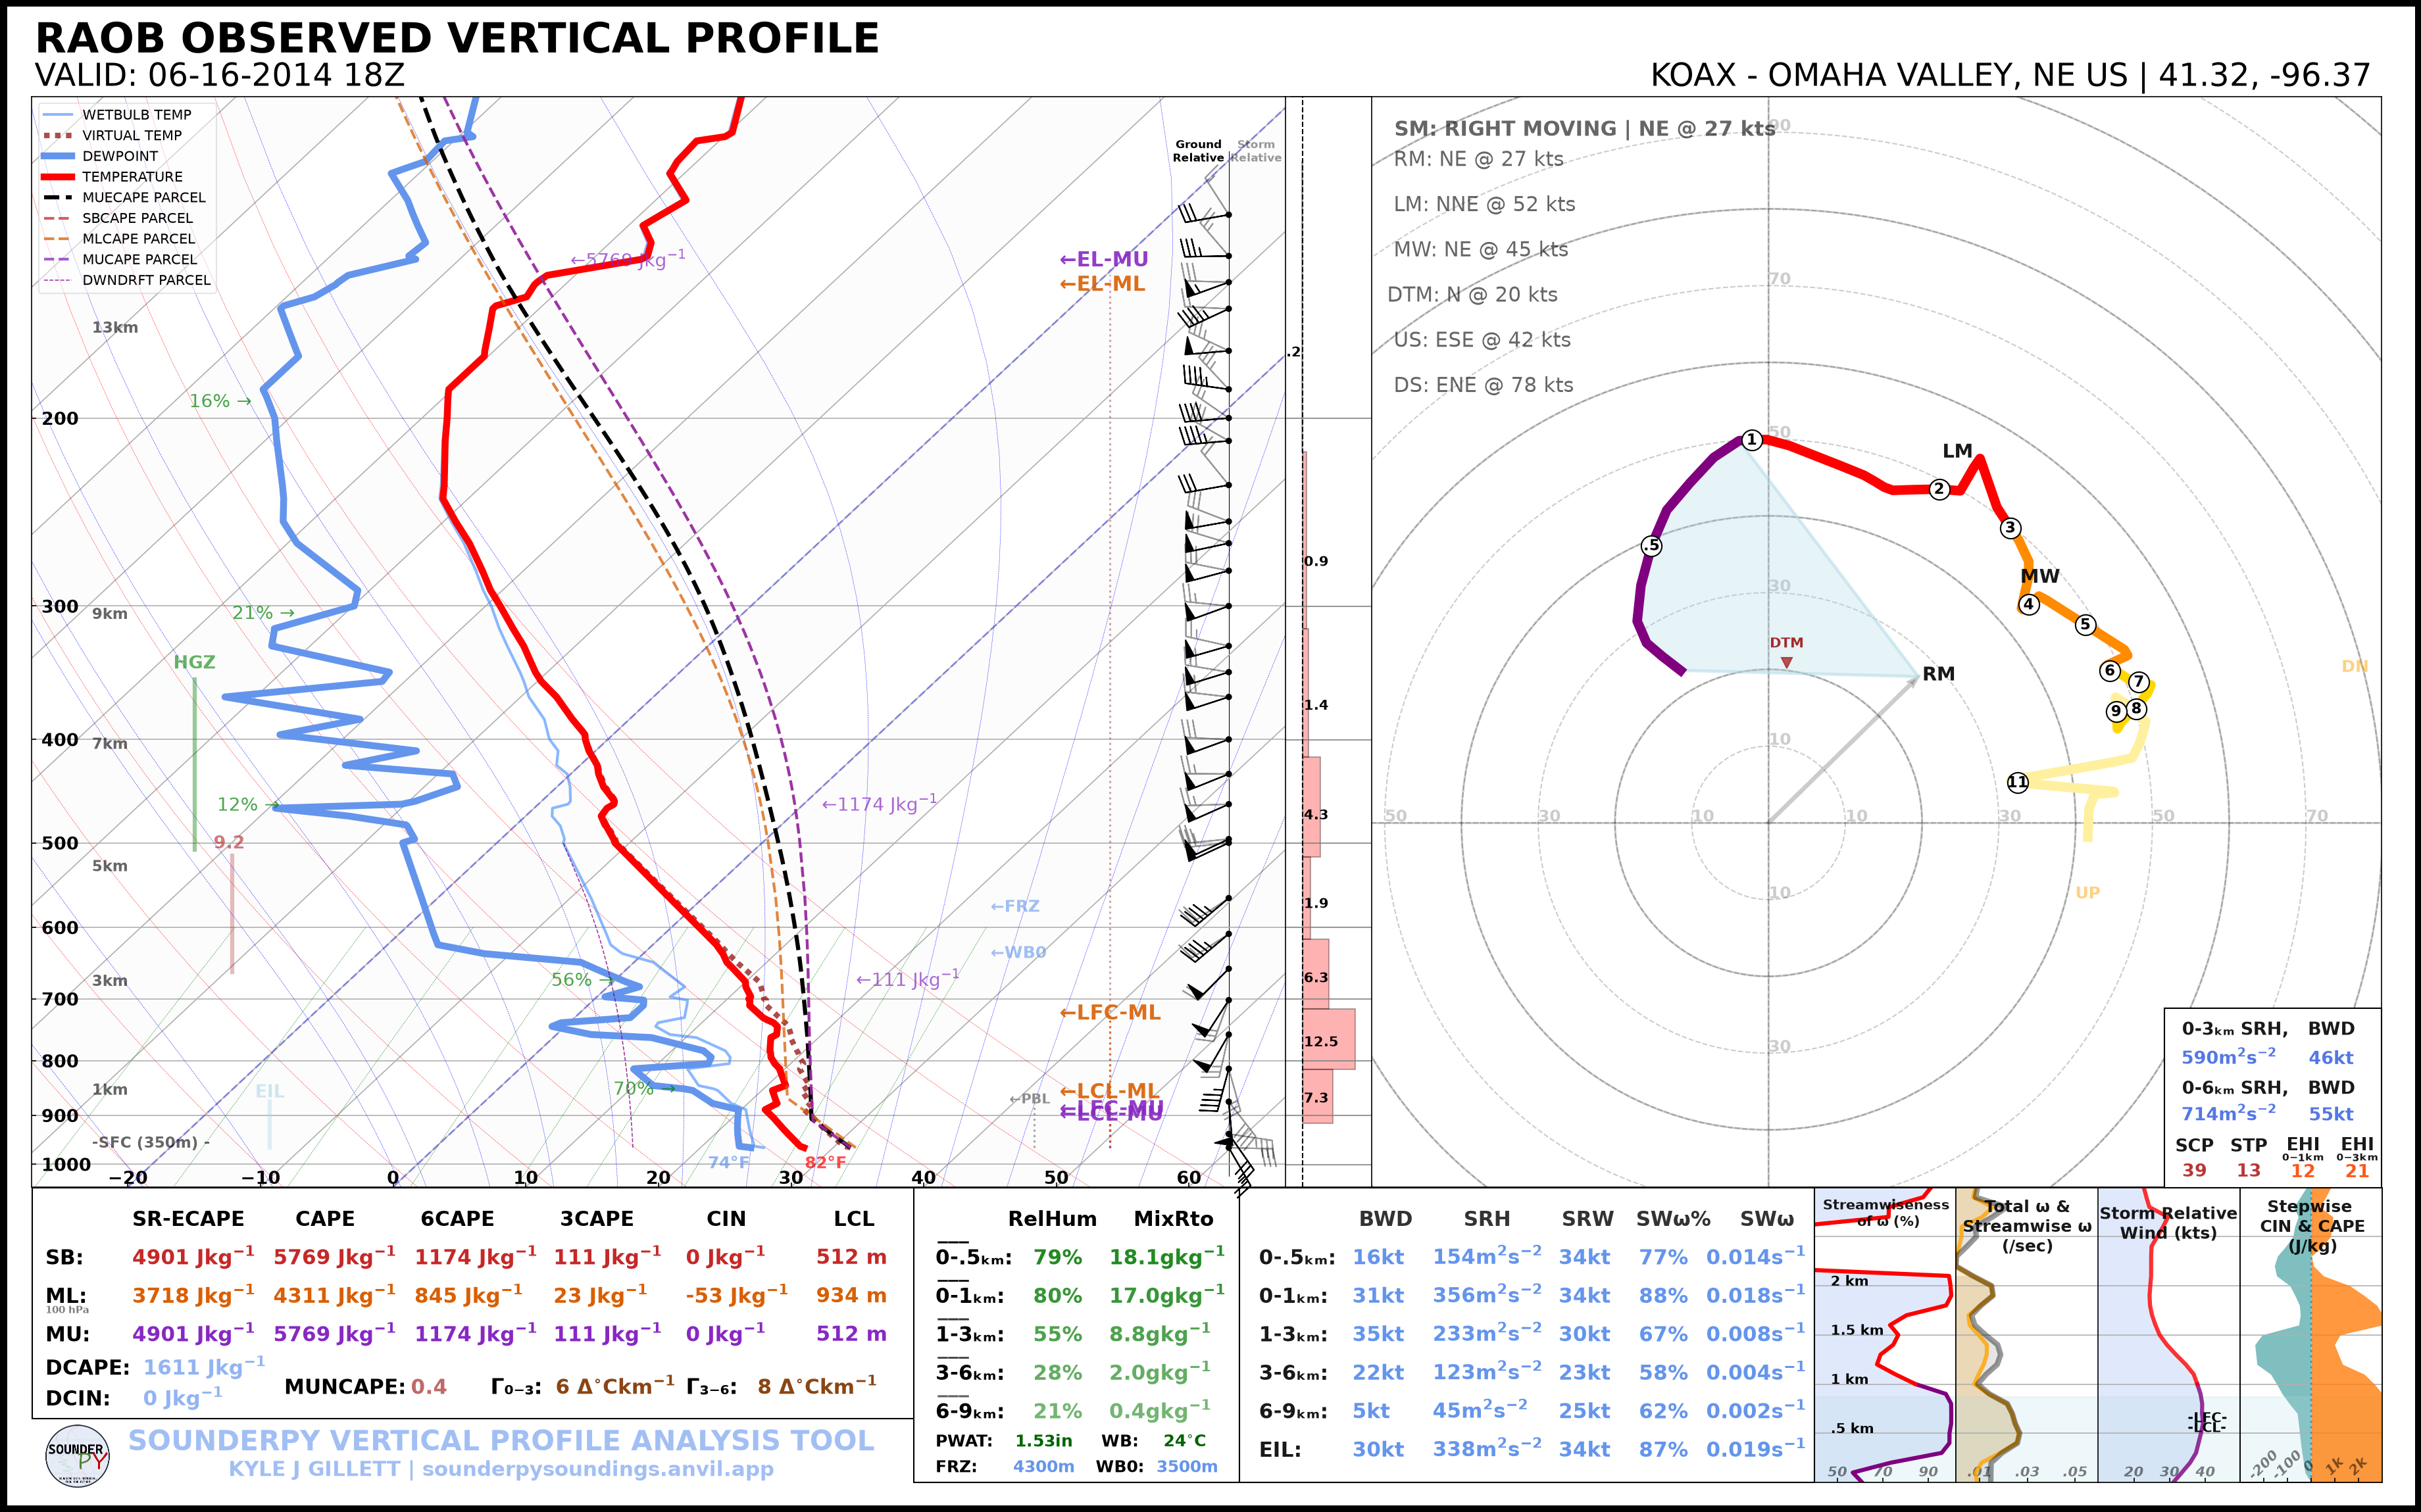
SounderPy can change the dewpoint-trace styling to improve visual distinction for users with color-vision deficiencies.
Standard Colors
spy.build_sounding(
    data,
    color_blind=False,
    radar=None,
    map_zoom=0,
)
Color-Deficiency-Friendly Colors
spy.build_sounding(
    data,
    color_blind=True,
    radar=None,
    map_zoom=0,
)
Combining Appearance Options
Appearance options can be combined:
spy.build_sounding(
    data,
    dark_mode=True,
    color_blind=True,
    radar=None,
    map_zoom=0,
)
Saving Figures
Set save=True and provide filename to save a figure instead of showing
it interactively:
spy.build_sounding(
    data,
    dark_mode=True,
    radar=None,
    map_zoom=0,
    save=True,
    filename="oax_dark_sounding.png",
)
The default figure resolution is 100 DPI. Increase it with dpi:
spy.build_sounding(
    data,
    dark_mode=True,
    radar=None,
    map_zoom=0,
    dpi=200,
    save=True,
    filename="oax_dark_sounding.png",
)
CLI Equivalents
Light-mode sounding:
sounderpy obs OAX 2014-06-16 18 \
    --plot sounding \
    --map-zoom 0
Dark-mode sounding:
sounderpy obs OAX 2014-06-16 18 \
    --plot sounding \
    --dark-mode \
    --map-zoom 0 \
    --plot-file oax_dark.png
Color-deficiency-friendly sounding:
sounderpy obs OAX 2014-06-16 18 \
    --plot sounding \
    --color-blind \
    --map-zoom 0 \
    --plot-file oax_colorblind.png
Combined:
sounderpy obs OAX 2014-06-16 18 \
    --plot sounding \
    --dark-mode \
    --color-blind \
    --map-zoom 0 \
    --dpi 200 \
    --plot-file oax_dark_colorblind.png
Next Steps
Continue to Maps & Radar to control the geographic inset and radar display.
See also: