🎈 SounderPy
VERTICAL PROFILE DATA RETRIEVAL & ANALYSIS FOR PYTHON
Retrieve, analyze, visualize, and export atmospheric vertical profiles from observations, forecasts, reanalyses, and numerical models.
pip install sounderpy
conda install sounderpy
Start Here
🚀 Getting Started
Install SounderPy, retrieve a profile, and create your first sounding.
👨🍳 Tutorials
Step-by-step guides for plots, radar, parcels, hodographs, data sources, exports, and command-line workflows.
📊 Plot Gallery
Explore sounding, hodograph, composite, radar, parcel, and data-source examples.
🌎 Data Sources
Work with RAOB, ACARS, RAP/RUC, BUFKIT, ERA5, NCEP, WRF, CM1, and custom vertical profiles.
📚 Reference
Find detailed retrieval, plotting, calculation, and helper-function documentation.
💻 Command Line Interface
Retrieve, plot, export, and automate SounderPy directly from a terminal.
Get a Sounding in Seconds
SounderPy provides the same core workflow through both Python and the command line.
Python
import sounderpy as spy

data = spy.get_obs_data(
    "OAX",
    "2014", "06", "16", "18")

spy.build_sounding(data)
Command Line
sounderpy obs OAX 2014-06-16 18 \
    --plot sounding
One Workflow, Many Data Sources, Several Plotting Options
Observations
RAOB, IRGAv2, ACARS
Forecasts
BUFKIT: HRRR, RAP, GFS, etc
Reanalysis
RAP, RUC, ERA5, NCEP-FNL
Modeling Systems
CM1, WRF, MPAS
Custom Sources
SHARPPY + more
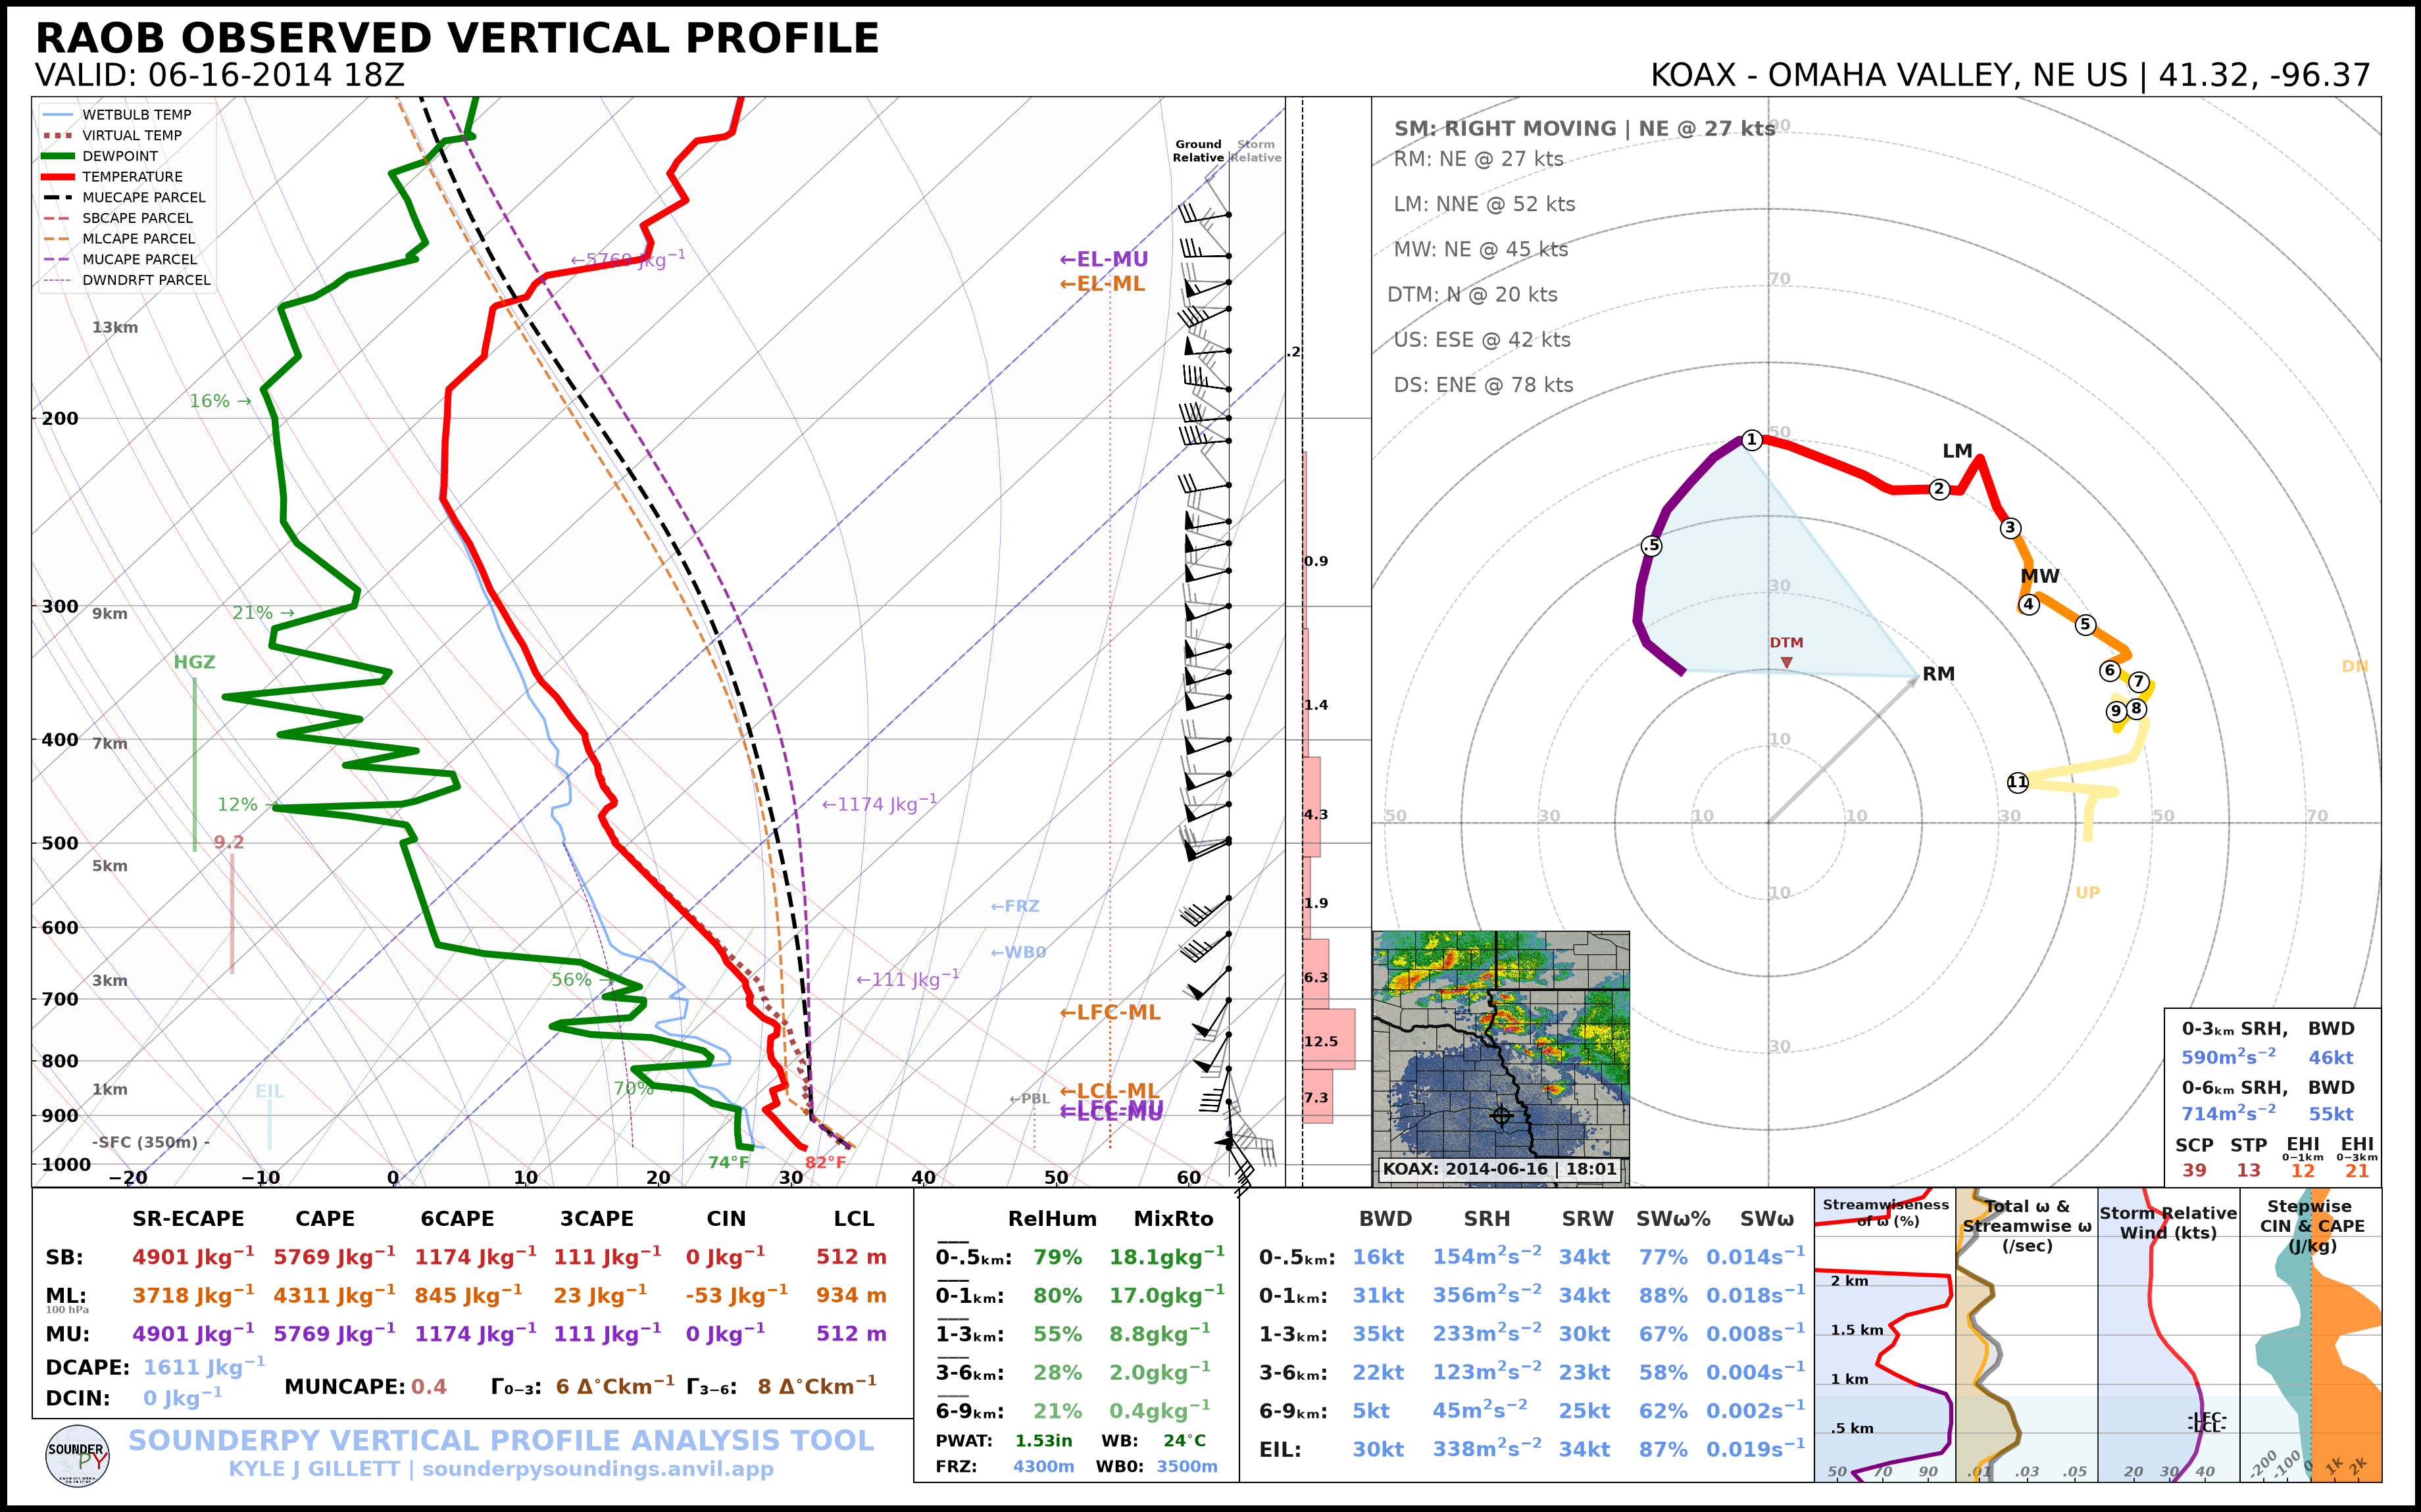
Soundings
Full Skew-T, Log-P diagram and hodograph figure.
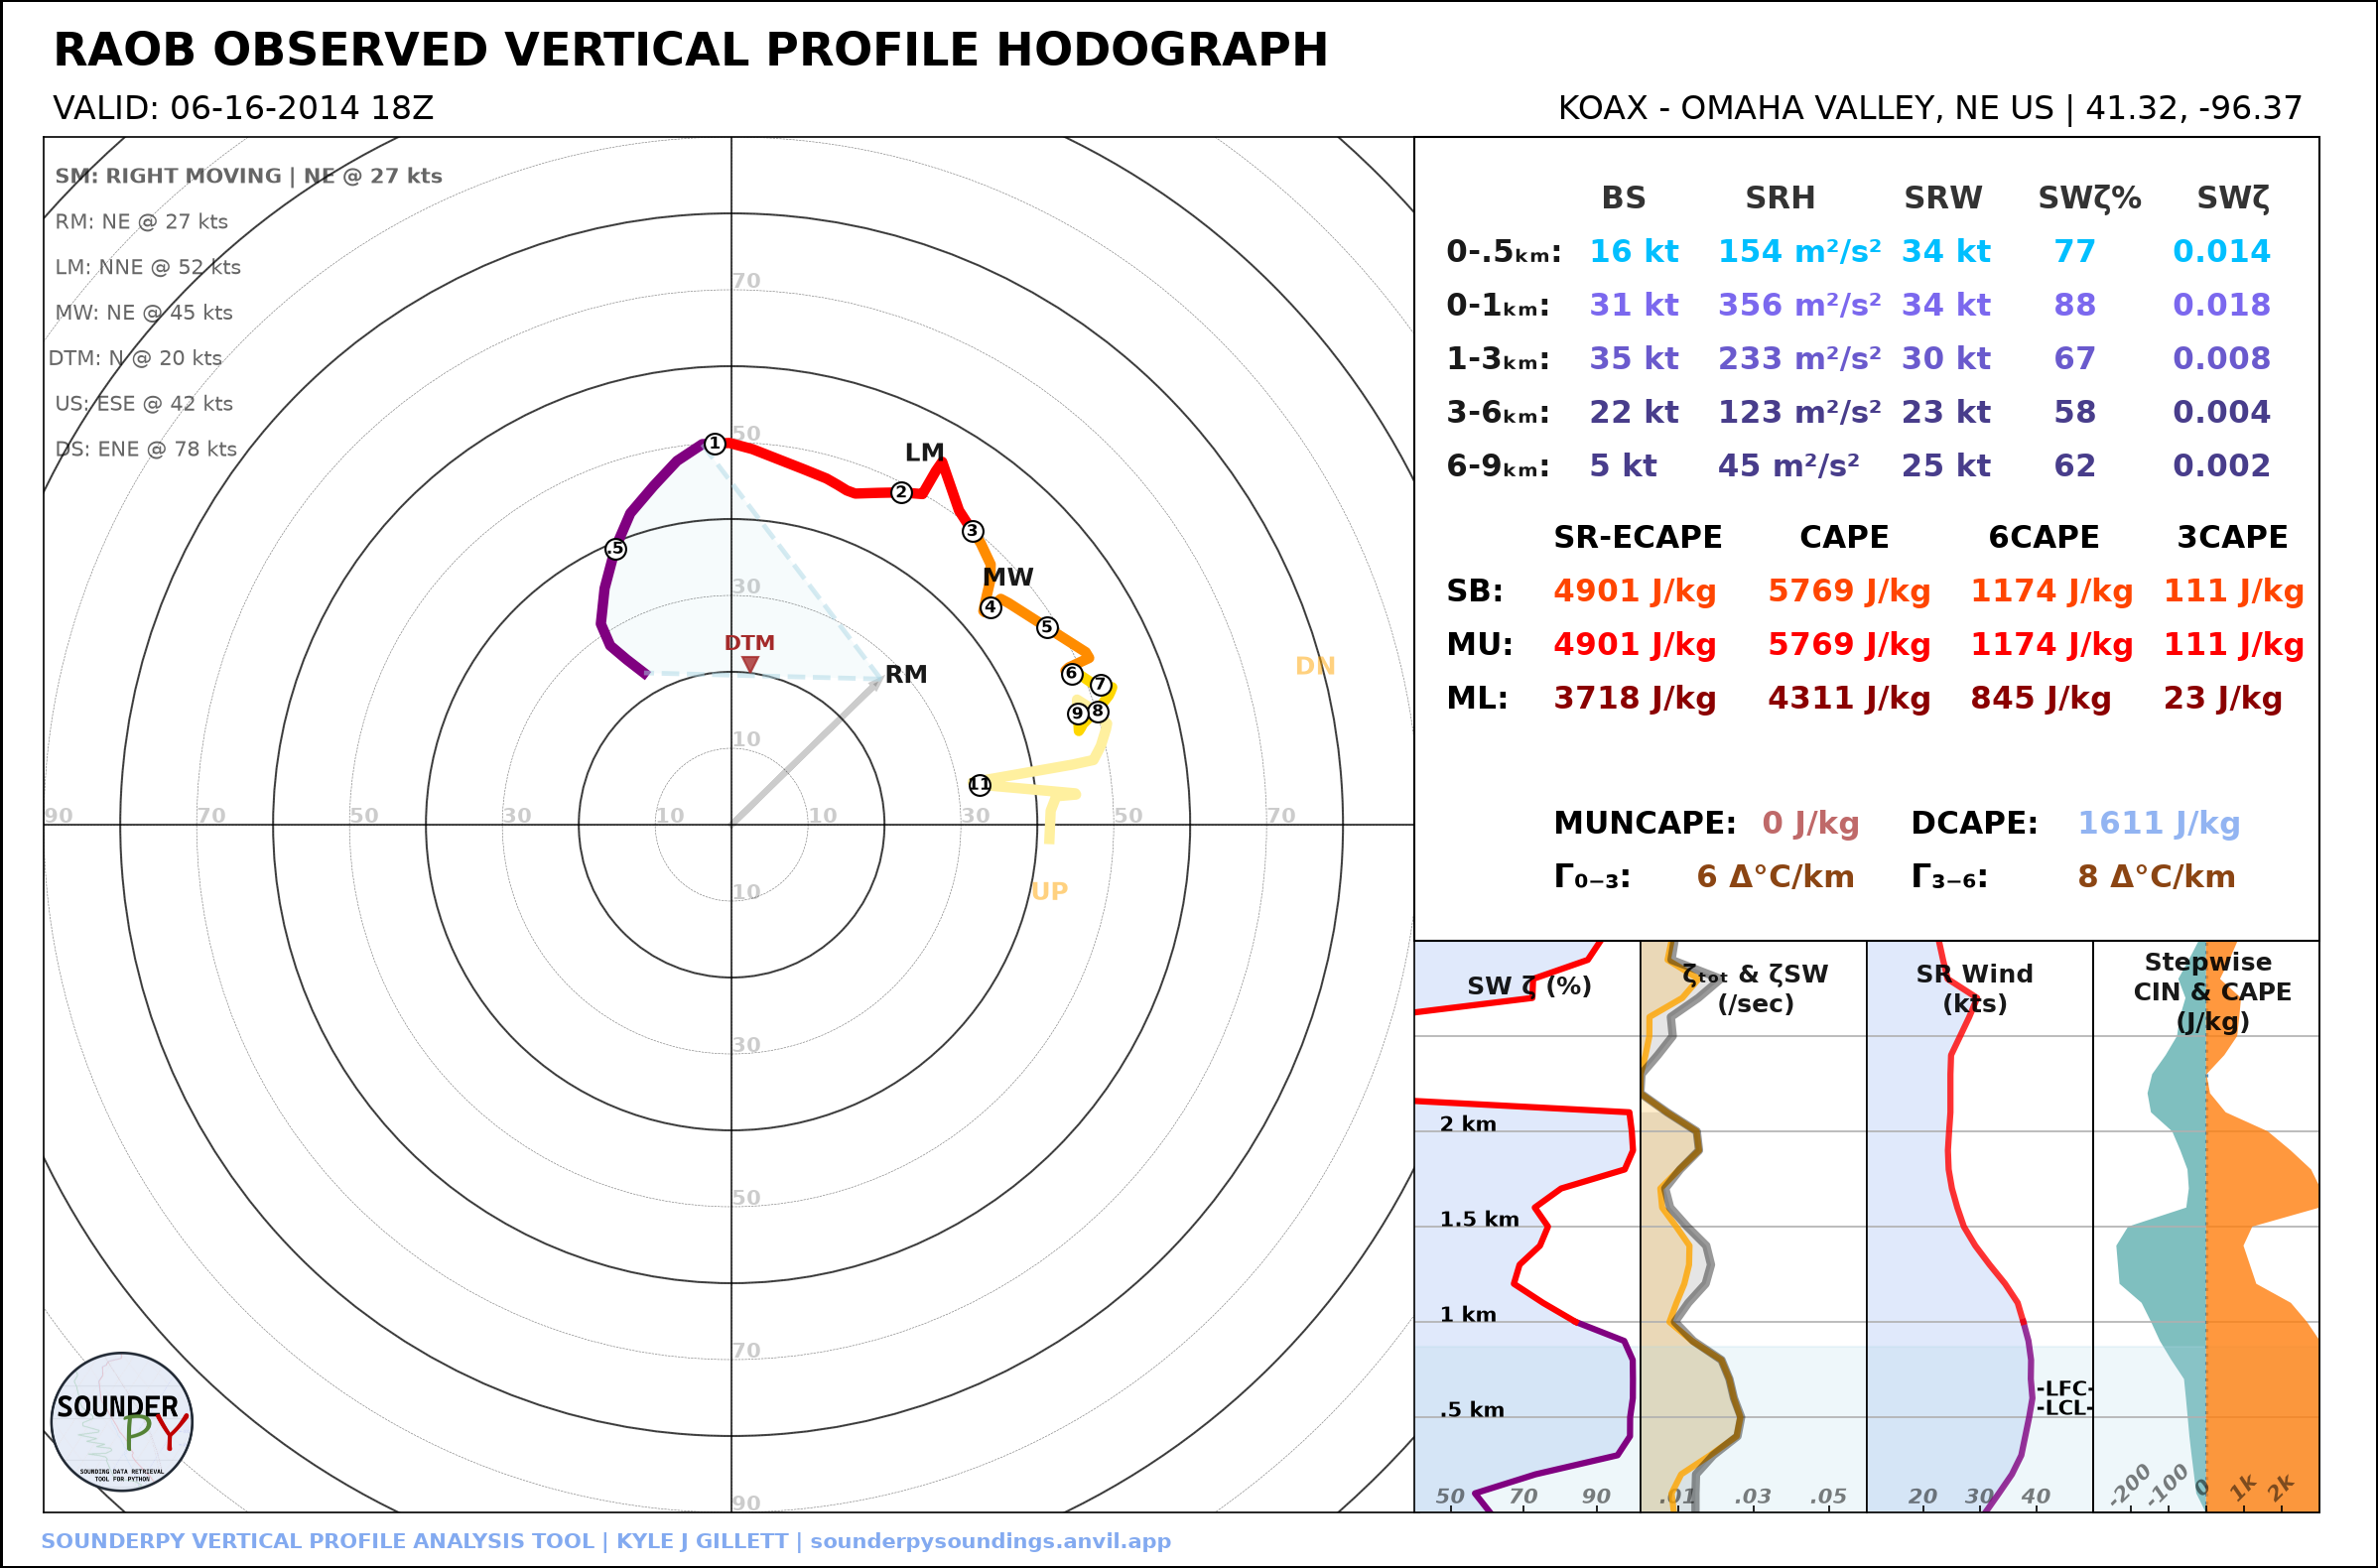
Hodographs
Simple hodograph figure.
Composite Soundings
Several profiles on one sounding.
What’s New in SounderPy 3.2.0
SounderPy 3.2.0 expands both how data are retrieved and how SounderPy can be used.
💻 New command line interface for retrieval, plotting, JSON, and export.
🌦️ Updated RAP/RUC reanalysis data access with modern GRIB2 archives.
📈 New and improved sounding plot features (such as storm-relative wind barbs and DPI settings)
🎈 Restored access to UW RAOB database.
📁 New file-io workflow for saving data to a file and for opening SHARPPY files.
📚 Expanded task-oriented tutorials and visual plot gallery.
🧰 Improved packaging, testing, and release infrastructure.
Using SounderPy in Research?
SounderPy is open-source scientific software developed for atmospheric vertical profile retrieval, analysis, and visualization.
☕ SounderPy is a open-source package developed on my own time. Would you like to support continued SounderPy development? Consider “Buying me a coffee”! ☕
Directory
API Reference:
- 🌐 Tools for Getting Data
- ✏️ Custom Data Sources
- 🧼 The
clean_dataSchema- 📈 Tools for Plotting Data
- 🛠️ Helper Tools
- 💻 Command Line Interface (CLI)
Tutorials:
- 👨🍳 SounderPy Beginner’s Cookbook
- Before We Get Started
- Recipe 1 — Set Up SounderPy
- Recipe 2 — Retrieve Your First Observed Sounding
- Recipe 3 — Understand
clean_data- Recipe 4 — Customize a SounderPy Sounding
- Recipe 5 — Build and Modify a Hodograph
- Recipe 6 — Retrieve Other Data Sources
- Recipe 7 — Calculate Sounding Parameters
- Recipe 8 — Compare Multiple Profiles
- Recipe 9 — Export a Profile
- Recipe 10 — Use the SounderPy Command Line
- Troubleshooting Tips
- 🎉 You Finished the SounderPy Beginner’s Cookbook!
- Where to go next
- 📊 Plot Gallery
- 📚 Tutorials
- 🎨 Plot Appearance & Accessibility
- 🗺️ Maps & Radar
- 🧪 Parcel Settings
- 🌀 Hodograph Options
- 🌎 Working with Data Sources
- 📚 Composite Soundings
- 💾 Exporting Data
- 💻 Command Line Workflows
- Check the Installation
- Observed Soundings
- Model/Reanalysis Profiles
- BUFKIT Forecasts
- ACARS Profiles
- Create a Sounding Plot
- Create a Hodograph
- Plot Styling
- Export a Profile
- Combine Retrieval, Export, and Plotting
- JSON Output
- JSON and a Saved Plot
- Verbose Mode
- Simple Shell Batch Workflow
- Check Exit Status in Scripts
- Use
python -m sounderpy- Next Steps
- Tutorial Overview
- Gallery Figures
- 🌪️ Case Study: Mound City, SD