Plotting Soundings with Observed RAOB Data
[1]:
# import sounderpy
import sounderpy as spy
## ---------------------------------- SOUNDERPY ----------------------------------- ##
##          Vertical Profile Data Retrieval and Analysis Tool For Python            ##
##                      v3.0.6 | Dec 2024 | (C) Kyle J Gillett                      ##
##                 Docs: https://kylejgillett.github.io/sounderpy/                  ##
## --------------------- THANK YOU FOR USING THIS PACKAGE! ------------------------ ##
Load RAOB Data
The function:
.get_obs_data('station', 'year', 'month', 'day', 'hour')where
stationis RAOB identifier for a given RAOB site, see: https://kylejgillett.github.io/sounderpy/gettingdata.html#available-raob-sites
[2]:
# Gaylord, MI EF3 tornado on 05/20/2022
clean_data = spy.get_obs_data('apx', '2022', '05', '20', '18')
> OBSERVED DATA ACCESS FUNCTION
  -----------------------------------
    > PROFILE FOUND: APX on 05/20/2022 at 18z | From UW
    > COMPLETE --------
    > RUNTIME: 00:00:02
    > SUMMARY: 18Z Launch for KAPX, GAYLORD at 05-20-2022-18Z

    > THERMODYNAMICS ---------------------------------------------
    --- SBCAPE: 2090.8 | MUCAPE: 2090.8 | MLCAPE: 1878.3 | MUECAPE: 1697.6
    --- MU 0-3: 71.1 | MU 0-6: 533.0 | SB 0-3: 71.1 | SB 0-6: 533.0

    > KINEMATICS -------------------------------------------------
    --- 0-500 SRW: 35.0 knot | 0-500 SWV: 0.019 | 0-500 SHEAR: 21.8 | 0-500 SRH: 186.2
    --- 1-3km SRW: 20.9 knot | 1-3km SWV: 0.005 | 1-3km SHEAR: 14.1 | | 1-3km SRH: 54.0
    ==============================================================
[3]:
# `clean_data` is a python dictionary of 'clean' vertical profile data
# it comes with temperature, dewpoint, pressure, height, u and v
# as well as a number of useful 'meta data'
clean_data
[3]:
{'p': <Quantity([944.  926.4 925.  894.5 863.5 850.  848.  833.4 804.1 795.  775.7 774.
  748.  721.2 720.  700.  685.  674.  670.  651.  645.1 630.  621.3 621.
  598.2 591.  587.  583.  572.  554.  509.  500.  473.6 471.  446.  442.
  425.  418.  402.  400.  399.  395.  386.  382.  370.  354.7 354.  336.
  311.2 300.  297.  279.  250.  241.  239.  237.6 232.  200.  194.  190.
  188.  170.  168.9 165.  162.  161.  160.6 155.  152.8 150.  138.2 135.
  131.3 131.  130.  127.  125.  124.8 122.  118.7 118.  113.  112.  111.
  108.  103.  102.  101.  100. ], 'hectopascal')>,
 'z': <Quantity([  446   610   623   914  1219  1356  1376  1524  1829  1926  2134  2152
   2438  2743  2757  2990  3168  3300  3349  3584  3658  3850  3962  3966
   4267  4364  4419  4473  4625  4877  5542  5680  6096  6137  6550  6617
   6911  7035  7323  7360  7378  7452  7620  7696  7925  8230  8243  8612
   9144  9400  9470  9900 10640 10880 10935 10973 11128 12070 12260 12389
  12454 13067 13106 13246 13356 13394 13411 13628 13716 13830 14326 14466
  14630 14645 14690 14831 14927 14935 15075 15240 15278 15544 15599 15655
  15826 16123 16184 16247 16310], 'meter')>,
 'T': <Quantity([ 26.   24.3  24.2  21.7  19.2  18.   17.4  16.4  14.3  13.6  13.4  13.4
   10.9   8.3   8.2   6.4   5.2   5.8   6.    4.2   3.6   2.    2.4   2.4
    0.2  -0.5  -0.7  -0.5  -0.9  -3.1  -9.1 -10.3 -14.1 -14.5 -16.9 -16.7
  -19.1 -19.7 -22.3 -22.5 -22.5 -22.5 -23.9 -24.5 -26.7 -29.6 -29.7 -32.7
  -36.1 -37.7 -37.9 -41.1 -47.1 -49.3 -49.5 -49.8 -51.1 -59.3 -61.3 -62.3
  -62.9 -68.1 -68.3 -68.9 -68.3 -63.9 -63.8 -62.1 -62.8 -63.7 -68.5 -69.9
  -70.3 -70.3 -68.1 -66.5 -65.3 -65.3 -65.3 -63.8 -63.5 -62.9 -61.9 -60.5
  -59.1 -58.7 -57.5 -55.3 -55.3], 'degree_Celsius')>,
 'Td': <Quantity([ 17.   16.3  16.2  15.6  15.   14.7  14.8  14.2  13.   12.6  10.    9.8
    8.7   7.5   7.4   5.3   4.1  -1.2  -3.   -3.8  -3.6  -3.   -4.5  -4.6
   -4.4  -4.3  -5.3  -8.5 -12.9 -14.1 -17.1 -17.3 -17.4 -17.4 -20.1 -22.7
  -26.1 -29.7 -31.3 -31.5 -31.5 -35.5 -37.6 -38.5 -36.8 -34.5 -34.4 -36.4
  -39.8 -41.4 -41.5 -45.7 -50.8 -53.  -54.3 -54.7 -56.1 -64.3 -66.3 -67.3
  -66.9 -72.  -72.2 -72.9 -72.5 -68.5 -68.4 -67.1 -67.8 -68.7 -73.5 -74.9
  -75.3 -75.3 -74.1 -74.5 -74.3 -74.4 -76.3 -76.5 -76.5 -78.9 -78.9 -78.5
  -79.1 -83.7 -83.5 -83.3 -83.3], 'degree_Celsius')>,
 'u': <Quantity([ 10.7246222   10.60660172  10.60660172  17.          22.36948102
   26.99707961  26.99707961  27.63986722  31.81980515  34.37362398
   39.83431104  39.83431104  42.13244437  45.05336244  45.05336244
   39.83431104  39.99960775  40.12982058  40.22445359  40.28302882
   40.30508653  40.30508653  40.30508653  40.30508653  55.92124435
   56.73165519  56.73165519  57.52478501  57.50175672  58.97894719
   60.00171105  60.62177826  64.08587988  64.08587988  58.51531863
   58.51531863  55.35225748  53.05840464  49.9682747   49.9682747
   49.9682747   48.32997061  44.23421039  43.93899135  44.16729559
   50.78742675  50.78742675  50.78742675  51.60657879  51.09549882
   51.09549882  53.85980316  57.09739058  55.28477501  54.37846722
   54.37846722  55.28477501  61.62892952  64.34785288  67.06677624
   67.97308403  77.94246969  78.84877747  91.15018422  99.6074178
  102.42649567 102.42649567  80.39200027  71.59831518  69.53725394
   67.61480784  52.13005469  33.7059555   34.47199994  37.03650542
   45.28821067  51.09549882  51.09549882  45.033321    37.23909236
   37.60864741  37.74069899  38.27679749  37.58770483  37.48920614
   36.5444686   36.63991854  35.80278823  35.86300913], 'knot')>,
 'v': <Quantity([ 8.99902654 10.60660172 10.60660172 29.44486373 31.94692973 32.17386661
  32.17386661 32.93991105 31.81980515 32.05392292 33.4249557  33.4249557
  35.35331853 31.546704   31.546704   33.4249557  34.77112854 36.13305274
  37.5099098  38.90086875 40.30508653 40.30508653 40.30508653 40.30508653
  46.92349551 45.94038855 45.94038855 44.9432877  43.33068167 41.29750342
  36.05266524 35.         37.         37.         36.56442923 36.56442923
  35.94617631 35.78834582 34.98816262 34.98816262 34.98816262 33.84100974
  30.97312756 29.63722388 25.5        35.56173905 35.56173905 35.56173905
  36.13531549 29.5        29.5        28.63776533 26.62495049 25.77971397
  25.3570957  25.3570957  25.77971397 28.7380418  30.00589658 31.27375137
  31.69636963 36.34517051 36.76778877 33.1759539  36.25413519 37.28019562
  37.28019562 35.79282459 33.38684268 25.30949061 18.11733316 25.42552651
  28.28265483 28.92544244 28.93608934 29.41050789 29.5        29.5
  26.         21.5        20.84681367 16.01997627 14.69308593 13.68080573
  10.74985688  5.78807521  5.14940474  3.76302468  3.13760674], 'knot')>,
 'site_info': {'site-id': 'KAPX',
  'site-name': 'GAYLORD',
  'site-lctn': 'MI US',
  'site-latlon': [44.92, -84.72],
  'site-elv': np.float64(446.0),
  'source': 'RAOB OBSERVED PROFILE',
  'model': 'no-model',
  'fcst-hour': 'no-fcst-hour',
  'run-time': ['none', 'none', 'none', 'none'],
  'valid-time': ['2022', '05', '20', '18']},
 'titles': {'top_title': 'RAOB OBSERVED VERTICAL PROFILE',
  'left_title': 'VALID: 05-20-2022 18Z',
  'right_title': 'KAPX - GAYLORD, MI US | 44.92, -84.72    '}}
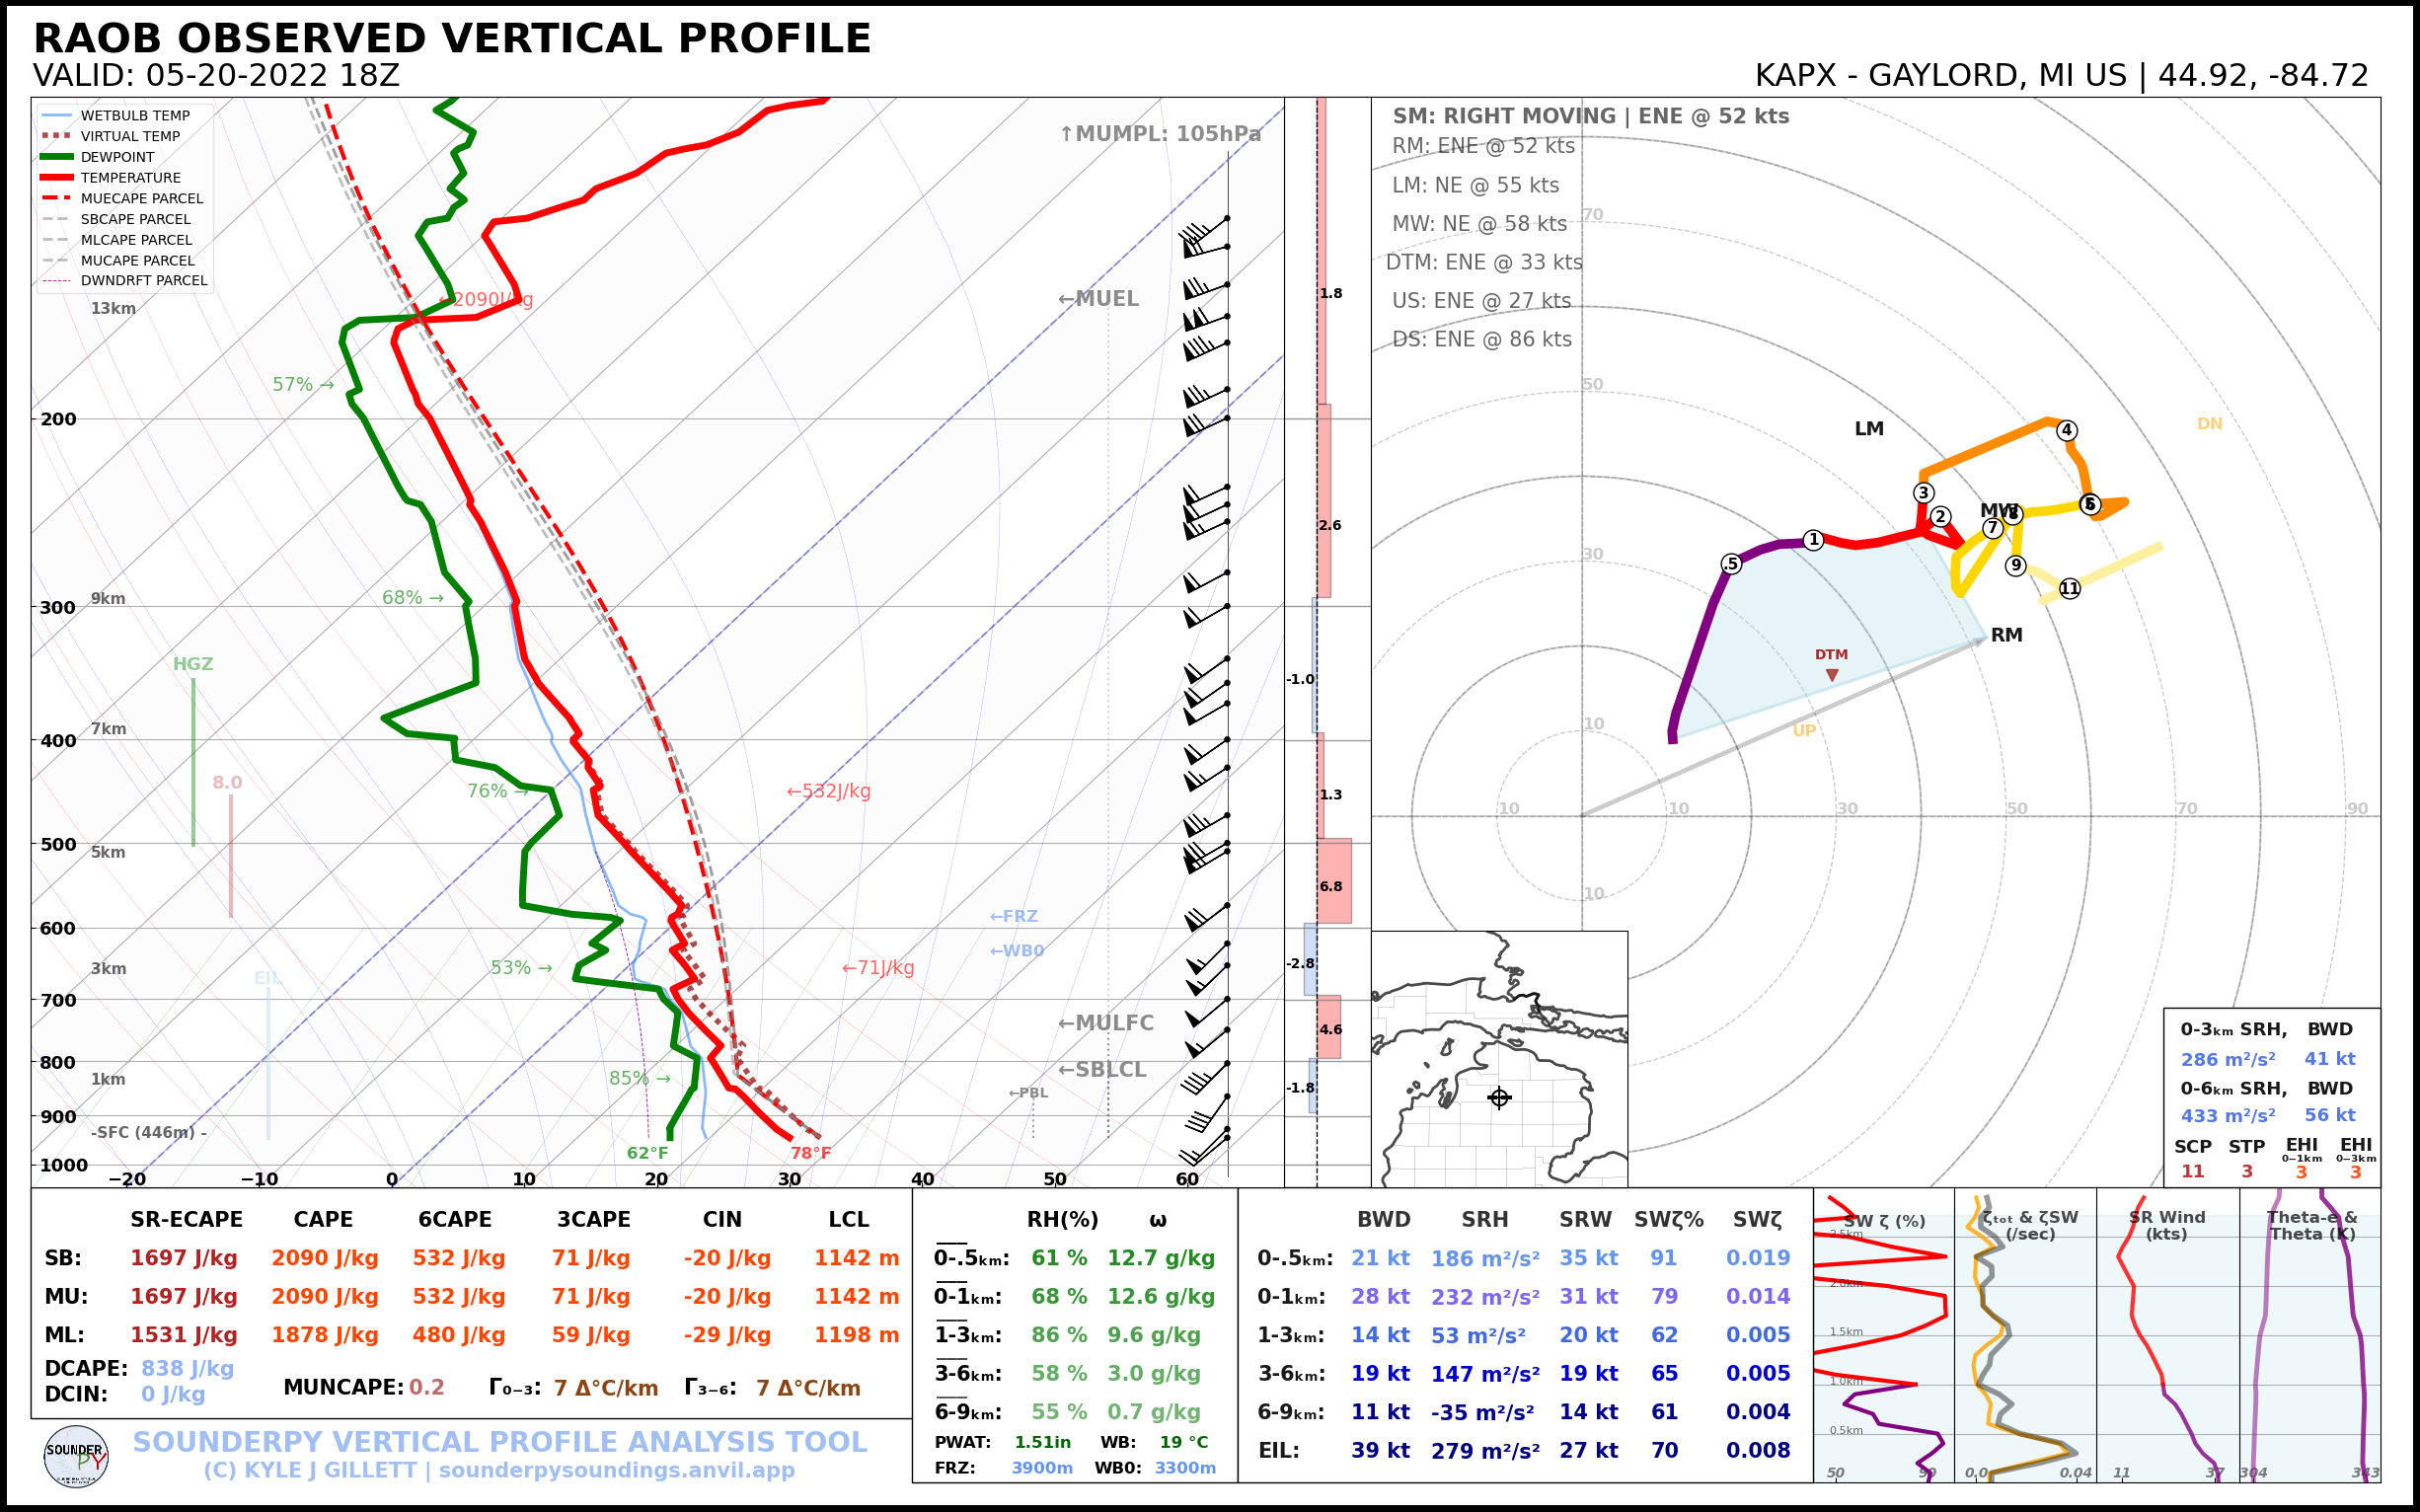
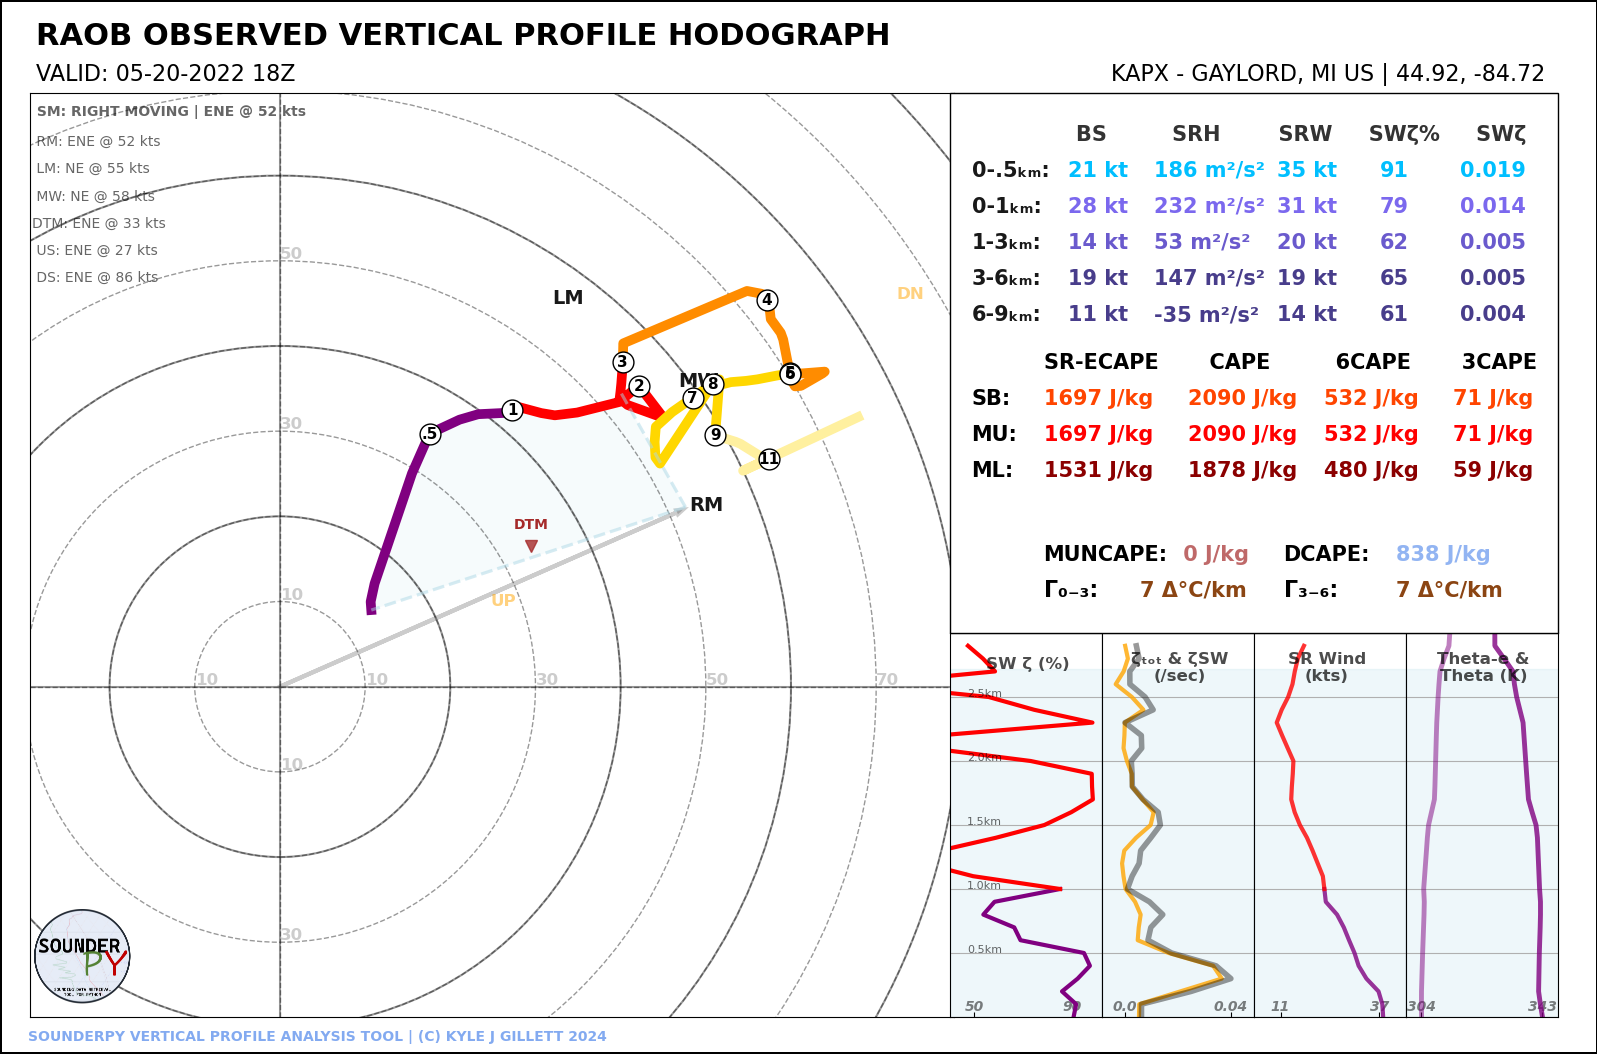
Build a plot of our RAOB data
The functions:
spy.build_sounding(clean_data), &spy.build_hodograph()
[4]:
# first here we can make a sounding!
spy.build_sounding(clean_data)
> SOUNDING PLOTTER FUNCTION
  ---------------------------------
- no radar data available -
    > COMPLETE --------
    > RUNTIME: 00:00:18

[5]:
spy.build_hodograph(clean_data)
> HODOGRAPH PLOTTER FUNCTION --
-------------------------------
> RUNTIME: 00:00:02

[ ]: