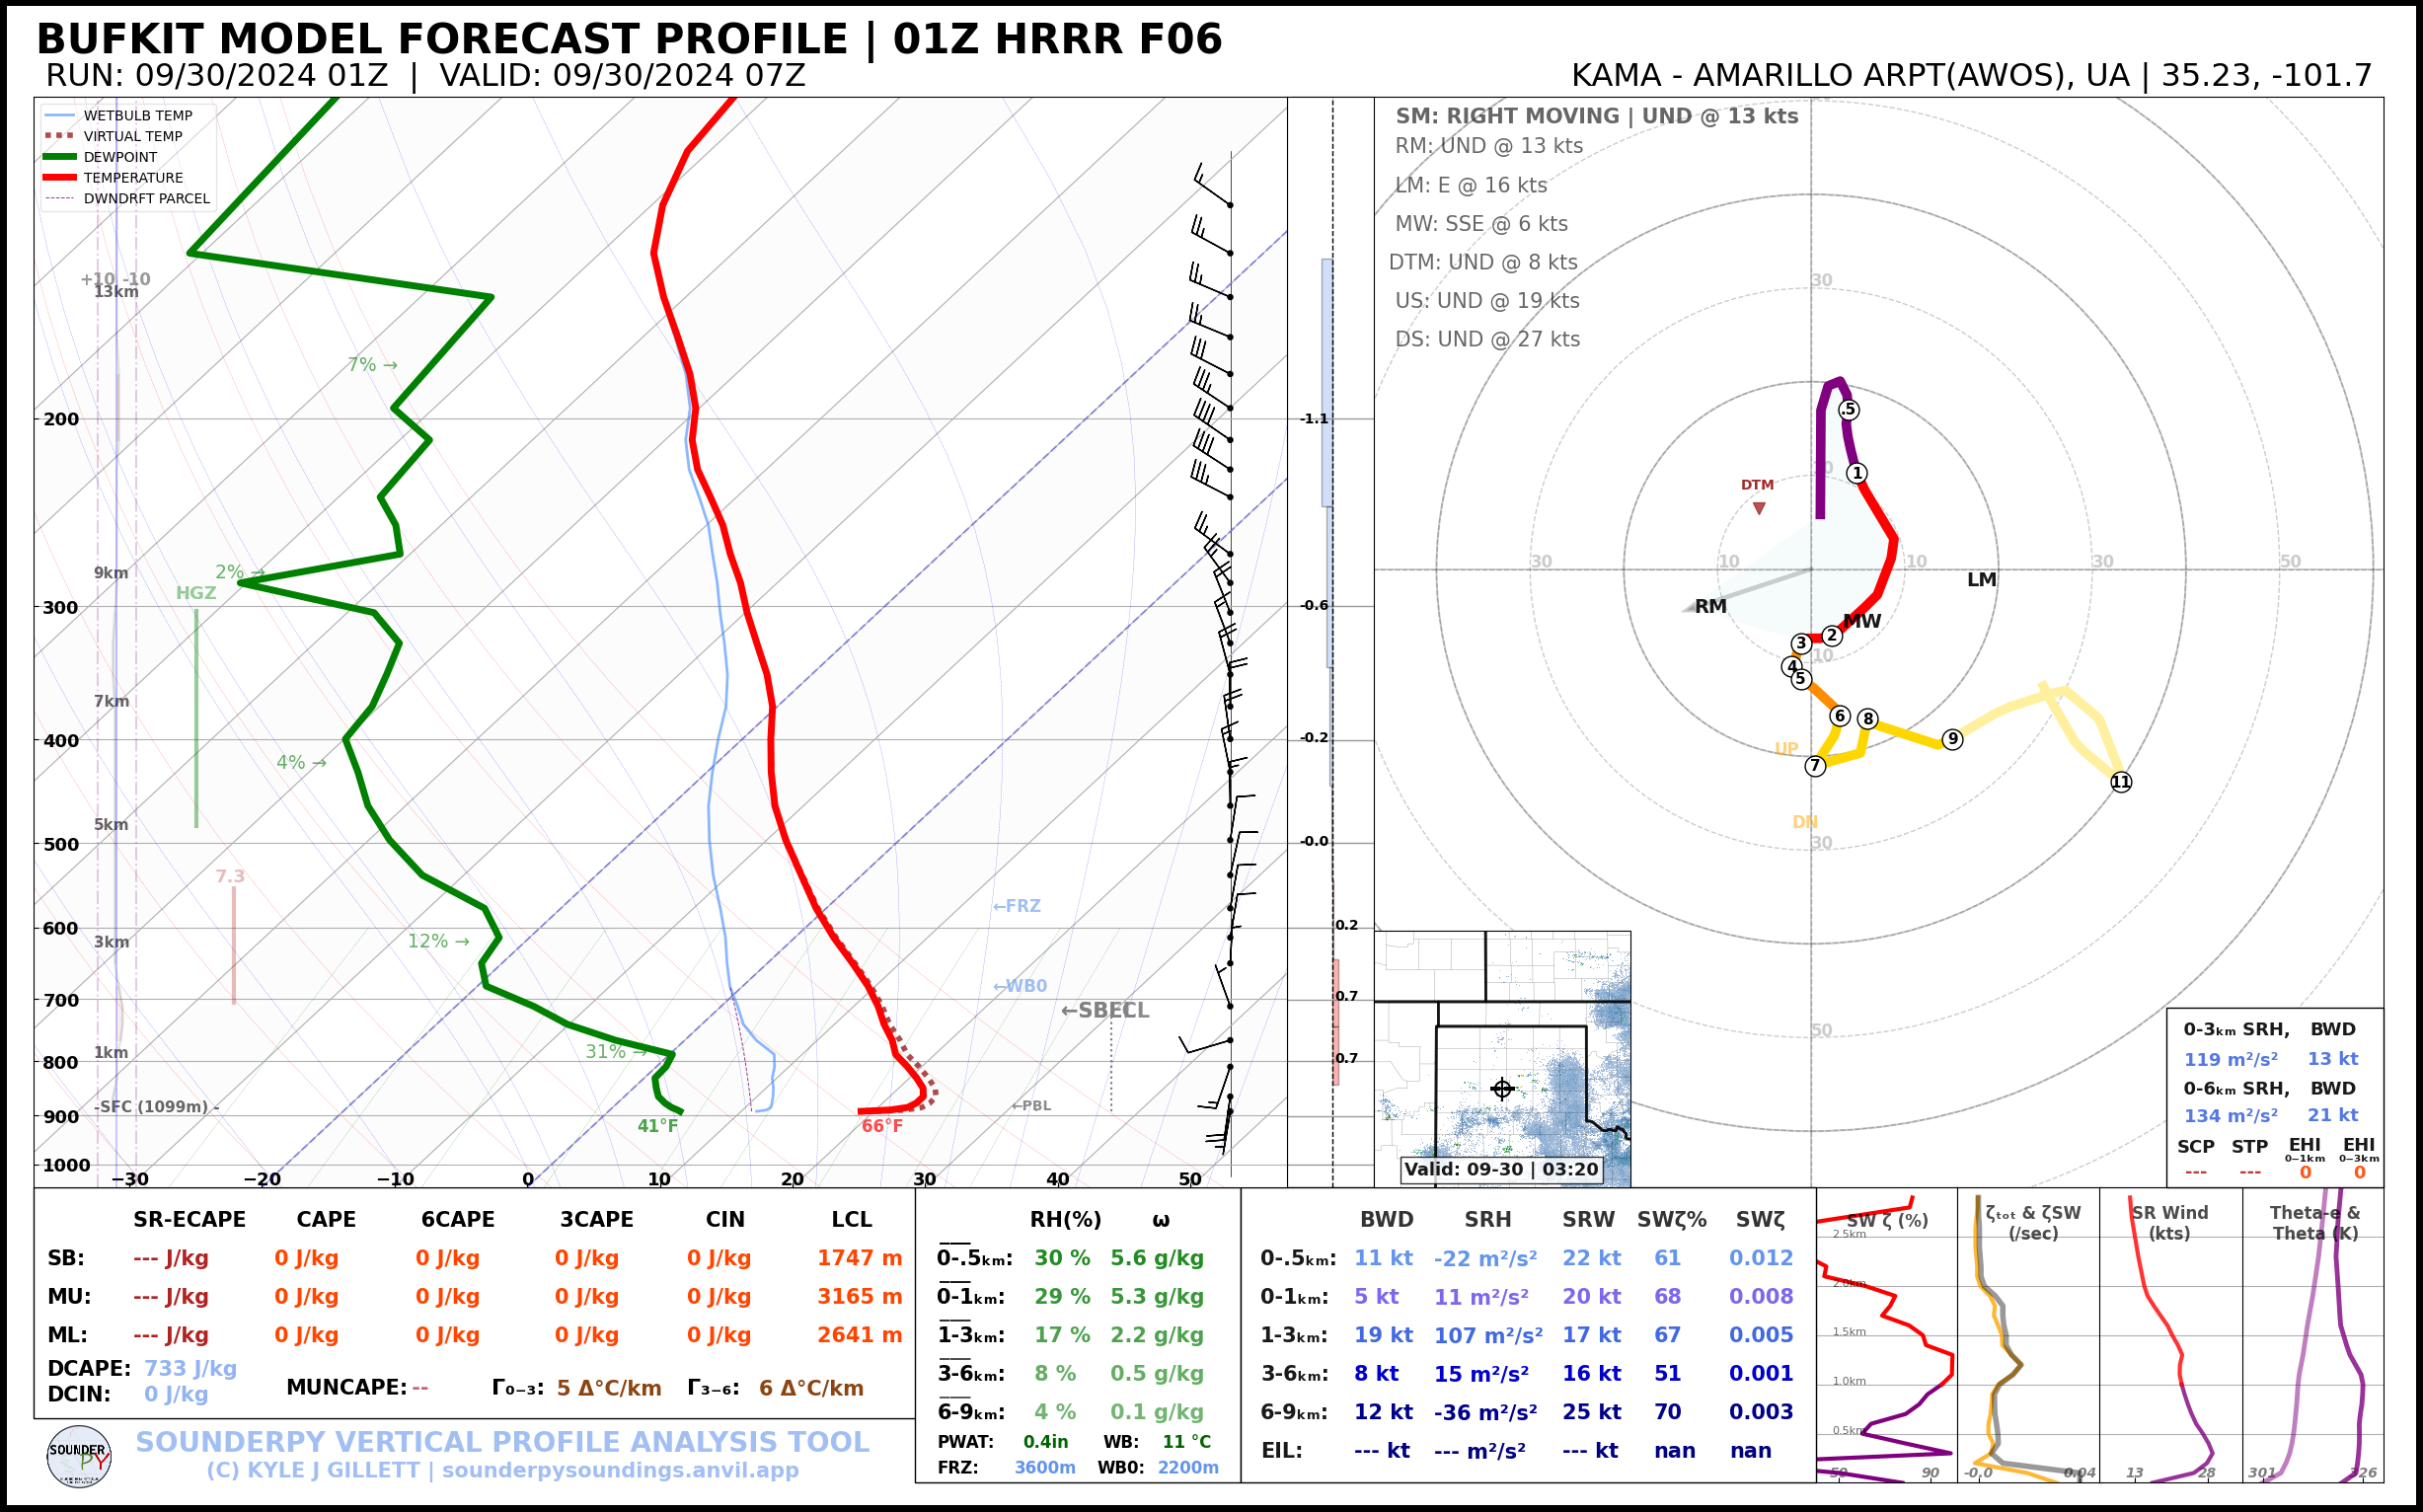
Plotting Soundings with BUFKIT Forecast Model Data
[1]:
# import sounderpy
import sounderpy as spy
## ---------------------------------- SOUNDERPY ----------------------------------- ##
##          Vertical Profile Data Retrieval and Analysis Tool For Python            ##
##                     v3.0.5 | Sept 2024 | (C) Kyle J Gillett                      ##
##                 Docs: https://kylejgillett.github.io/sounderpy/                  ##
## --------------------- THANK YOU FOR USING THIS PACKAGE! ------------------------ ##
Understanding SounderPy Functionality
To get model forecast data via BUFKIT, we need to use the ``get_bufkit_data()`` function
Reading the documentation on BUFKIT data access may prove useful before using this notebook: https://kylejgillett.github.io/sounderpy/gettingdata.html#model-forecast-data-bufkit
[2]:
################################ THE FUNCTION ###################################
# to get bufkit data, we need to use the `get_bufkit_data()` function
# `get_bufkit_data(model, station, fcst_hr, run_year, run_month, run_day, run_hour)`
################################################################################


########################## TYPES OF BUFKIT DATA ################################
# we can access archived model forecasts from the GFS, NAM, RAP & HRRR
# or most recent run forecasts from the GFS, NAM, NAMNEST, RAP, HRRR, SREF, & HIRESW
################################################################################


########################## WHERE DATA IS AVAILABLE #############################
# NOTE: bufkit forecast data is *only available at specific BUFKIT site locations*
# you can find them here: http://www.meteo.psu.edu/bufkit/DomainNAMRAP_NAM_12.html
################################################################################


############################# LETS GET SOME DATA ###############################
# to get archived forecasts we need every kwarg. (a kwarg is a Keyword Argument, like 'year', and 'station')
# the line below will get us a 12z GFS forecast from 08/05/2023 at forecast hour 6 for bufkit site KMOP:

# clean_data = spy.get_bufkit_data('gfs', 'kmop', 6, '2023', '08', '05', '12')

# to get the most recent forecasts we use the same function, but we *don't need a year, month, day or hour kwarg!*
# you just need a model, station and forecast hour.
# this will get you the most recent HRRR run, at forecast hour 6, for
# site `KAMA` (AMARILLO ARPT(AWOS)):


clean_data = spy.get_bufkit_data('hrrr', 'kama', 6)
> BUFKIT DATA ACCESS FUNCTION
   ---------------------------------
    > COMPLETE --------
    > RUNTIME: 00:00:00
    > SUMMARY: SUMMARY: 01Z HRRR F06 for KAMA,AMARILLO ARPT(AWOS) at 09-30-2024-07Z

    > THERMODYNAMICS ---------------------------------------------
    --- SBCAPE: 0.0 | MUCAPE: 0.0 | MLCAPE: 0.0 | MUECAPE: --
    --- MU 0-3: 0.0 | MU 0-6: 0.0 | SB 0-3: 0.0 | SB 0-6: 0.0

    > KINEMATICS -------------------------------------------------
    --- 0-500 SRW: 22.1 knot | 0-500 SWV: 0.012 | 0-500 SHEAR: 11.6 | 0-500 SRH: -22.5
    --- 1-3km SRW: 17.7 knot | 1-3km SWV: 0.005 | 1-3km SHEAR: 19.1 | | 1-3km SRH: 107.2
    ==============================================================
[3]:
# Lets check out the BUFKIT data that we just accessed
# and stored in the `clean_data` variable:

# `clean_data` is a python dictionary of 'clean' vertical profile data
# it comes with temperature, dewpoint, pressure, height, u and v
# as well as a number of useful 'meta data'

clean_data
[3]:
{'p': array([891.8, 889.2, 884.3, 876. , 863.8, 848.3, 830. , 810.1, 788.7,
        765. , 739.2, 711.1, 680.7, 648.1, 613.1, 575.6, 535.9, 496.9,
        461.4, 429.1, 399.6, 372.5, 347.7, 325. , 304.3, 285.4, 268.2,
        252. , 237.2, 223.5, 209.7, 195.8, 181.9, 168. , 154.1, 140.2,
        126.4, 112.5,  98.6,  85.7,  75.3,  66.9,  59.1]) <Unit('hectopascal')>,
 'z': array([ 1106.64,  1131.8 ,  1179.67,  1261.54,  1383.33,  1540.37,
         1728.85,  1937.53,  2166.38,  2425.58,  2715.15,  3039.96,
         3403.25,  3807.34,  4259.15,  4766.1 ,  5332.18,  5921.95,
         6492.23,  7043.56,  7578.68,  8100.95,  8607.78,  9098.21,
         9570.  , 10023.95, 10458.54, 10888.67, 11301.12, 11700.96,
        12123.7 , 12573.5 , 13050.5 , 13557.18, 14097.28, 14676.57,
        15300.17, 15991.56, 16767.49, 17591.65, 18355.48, 19057.97,
        19798.95]) <Unit('meter')>,
 'T': array([ 19.04,  21.14,  22.24,  22.54,  22.54,  21.84,  20.54,  18.94,
         17.04,  15.64,  13.74,  11.84,   9.44,   6.44,   2.94,  -0.76,
         -4.56,  -8.56, -12.16, -15.16, -17.86, -20.36, -23.36, -26.66,
        -29.86, -32.76, -35.86, -38.76, -41.96, -45.16, -47.96, -50.26,
        -53.46, -57.36, -61.66, -65.96, -69.16, -71.66, -72.66, -72.06,
        -70.86, -69.66, -68.26]) <Unit('degree_Celsius')>,
 'Td': array([   5.39,    5.1 ,    4.43,    3.59,    2.57,    1.73,    0.81,
           0.73,    0.22,   -5.23,  -10.13,  -14.12,  -19.35,  -21.54,
         -22.28,  -25.75,  -33.13,  -38.42,  -42.84,  -46.31,  -49.93,
         -50.54,  -52.03,  -53.6 ,  -57.98,  -70.47,  -60.74,  -63.41,
         -66.86,  -67.29,  -67.75,  -73.05,  -73.54,  -74.08,  -74.65,
        -100.94, -101.43, -101.97, -102.58, -103.23, -103.82, -104.35,
        -104.91]) <Unit('degree_Celsius')>,
 'u': array([ 0.97136174,  1.55462148,  0.97216307,  1.16480613,  2.9160719 ,
         4.08005986,  3.69202977,  4.27471044,  5.05259535,  9.13328918,
         6.99691621,  2.52753929,  0.97242013, -0.38857584, -1.36089259,
        -1.75036797, -2.33241795, -1.74950424,  0.19412883,  3.11069421,
         2.52716803,  0.38848813,  5.24892528,  6.0259933 ,  6.61034747,
        13.80245445, 20.41111293, 27.01875861, 30.7100709 , 32.85351073,
        33.03983283, 28.37762667, 24.87687599, 23.90654375, 23.71476314,
        20.60613188, 12.82870145,  8.74264972,  8.16479539,  1.5542662 ,
        -4.08353311, -5.05125965, -4.08353311]) <Unit('knot')>,
 'v': array([  5.82962746,  11.66687842,  15.94038265,  19.04441195,
         20.41276377,  18.07523199,  15.15681088,  12.43580921,
          9.5225879 ,   2.72101612,  -2.91540111,  -6.99750993,
         -7.38626422,  -7.38979085,  -8.16739685,  -9.91670873,
        -10.68847166, -11.27507583, -12.63850917, -15.35814056,
        -17.69040197, -20.99640629, -19.63036381, -15.93891479,
        -16.52704772, -18.85866249, -14.9660472 , -12.82944984,
        -15.93899449, -21.38426601, -22.74162586, -18.85405008,
        -12.82891814,  -9.91219279, -10.11031201, -11.27685368,
         -9.13711766,  -2.52508926,  -1.74889   ,  -0.5829722 ,
          2.13935909,   6.02199103,   2.13935909]) <Unit('knot')>,
 'omega': array([ 0.1,  0.2,  0.2,  0.2,  0.2,  0.1,  0. ,  0. ,  0. , -0.2, -0.3,
        -0.3, -0.1,  0.1,  0.1,  0.1,  0.1,  0.1,  0.1,  0.1,  0.1,  0.1,
         0.2,  0.2,  0.1,  0. ,  0. ,  0. ,  0. ,  0. , -0.1, -0.1, -0.1,
         0. ,  0. ,  0. ,  0. ,  0. ,  0. ,  0. ,  0. ,  0. ,  0. ]) <Unit('pascal / second')>,
 'site_info': {'site-id': 'KAMA',
  'site-name': 'AMARILLO ARPT(AWOS)',
  'site-lctn': 'UA',
  'site-latlon': [35.23, -101.7],
  'site-elv': 1099,
  'source': 'BUFKIT FORECAST PROFILE',
  'model': 'HRRR',
  'fcst-hour': 'F06',
  'run-time': ['2024', '09', '30', '01'],
  'valid-time': ['2024', '09', '30', '07']},
 'titles': {'top_title': 'BUFKIT MODEL FORECAST PROFILE | 01Z HRRR F06',
  'left_title': ' RUN: 09/30/2024 01Z  |  VALID: 09/30/2024 07Z',
  'right_title': 'KAMA - AMARILLO ARPT(AWOS), UA | 35.23, -101.7    '}}
LETS PLOT THE DATA ON A SOUNDING AND HODOGRAPH
[4]:
# lets make a sounding!
spy.build_sounding(clean_data)
> SOUNDING PLOTTER FUNCTION
  ---------------------------------
    > COMPLETE --------
    > RUNTIME: 00:00:03

[ ]: