Plotting Soundings with Observed ACARS data
[1]:
# import sounderpy
import sounderpy as spy
## ---------------------------------- SOUNDERPY ----------------------------------- ##
##          Vertical Profile Data Retrieval and Analysis Tool For Python            ##
##                     v3.0.5 | Sept 2024 | (C) Kyle J Gillett                      ##
##                 Docs: https://kylejgillett.github.io/sounderpy/                  ##
## --------------------- THANK YOU FOR USING THIS PACKAGE! ------------------------ ##
Understanding ACARS functionality
To get ACARS data, we need to use the ``acars_data()`` class
Reading the documentation on ACARS data access may prove useful before using this notebook: https://kylejgillett.github.io/sounderpy/gettingdata.html#observed-data-acars-aircraft-obs
[2]:
# First we need to set up a 'connection' to the ACARS data.
# We do this by creating a variable called `acars_conn` which is set equal
# to the `acars_data()` class. The class needs a year, month, day and hour as strs.

# Lets look for flights on Dec. 30th 2023 at 12 UTC
acars_conn = spy.acars_data('2024', '02', '28', '01')

# Now that we have the connection established, lets look for a profile
# to plot. We can do this by using the `.list_profiles() function:
acars_conn.list_profiles()
> LIST ACARS PROFILES FUNCTION
  ---------------------------------
> AVAILABLE ACARS PROFILES FOR 2024-02-28 01Z...
> COMPLETE --------
> RUNTIME: 00:00:00
[2]:
['ATL_0120',
 'ATL_0140',
 'AUS_0130',
 'AUS_0140',
 'BNA_0110',
 'BNA_0140',
 'BOI_0130',
 'BWI_0120',
 'CHS_0100',
 'CMH_0150',
 'DAL_0100',
 'DAL_0130',
 'DTW_0100',
 'FLL_0140',
 'HDN_0120',
 'HOU_0130',
 'HOU_0140',
 'IND_0100',
 'JAN_0120',
 'JAX_0110',
 'LAS_0130',
 'LAS_0150',
 'LAX_0110',
 'LAX_0130',
 'LGA_0140',
 'LGB_0120',
 'MCO_0110',
 'MCO_0150',
 'MDW_0150',
 'MFE_0140',
 'MIA_0120',
 'MSY_0120',
 'OKC_0100',
 'PHX_0120',
 'PHX_0150',
 'SAN_0100',
 'SAT_0110',
 'SAT_0140',
 'SBA_0110',
 'SJC_0130',
 'SLC_0140',
 'TPA_0100',
 'TPA_0110']
[5]:
# These are all the available flights we can get data from across the ACARS network
# on Dec. 30th 2023 at 12 UTC. Now we can pick one and add it to the function
# `.get_profile()` to actually get the data. Lets try 'DAL_1210':
clean_data = acars_conn.get_profile('SJC_0130')
> ACARS DATA ACCESS FUNCTION
  ---------------------------------
    > COMPLETE --------
    > RUNTIME: 00:00:01
    > SUMMARY: 01:30Z Flight from SJC, Norman Y. Mineta San Jose International Airport at 02-28-2024-01:30Z

    > THERMODYNAMICS ---------------------------------------------
    --- SBCAPE: 0.0 | MUCAPE: 0.0 | MLCAPE: 0.0 | MUECAPE: --
    --- MU 0-3: 0.0 | MU 0-6: 0.0 | SB 0-3: 0.0 | SB 0-6: 0.0

    > KINEMATICS -------------------------------------------------
    --- 0-500 SRW: 17.9 knot | 0-500 SWV: 0.002 | 0-500 SHEAR: 3.4 | 0-500 SRH: -10.0
    --- 1-3km SRW: 11.9 knot | 1-3km SWV: 0.006 | 1-3km SHEAR: 10.5 | | 1-3km SRH: 17.5
    ==============================================================
[7]:
# Lets check out the ACARS data that we just accessed
# and stored in the `clean_data` variable:

# `clean_data` is a python dictionary of 'clean' vertical profile data
# it comes with temperature, dewpoint, pressure, height, u and v
# as well as a number of useful 'meta data'

clean_data
[7]:
{'p': <Quantity([1010.28  985.84  954.98  919.68  880.71  845.17  808.79  769.16  732.87
   704.22  693.73  640.81  584.25  529.53  481.79  435.84  385.14  327.46
   286.74  251.86  230.16  225.53  204.27], 'hectopascal')>,
 'z': <Quantity([   27.   233.   499.   812.  1169.  1506.  1863.  2267.  2652.  2967.
   3085.  3703.  4411.  5151.  5849.  6576.  7454.  8575.  9467. 10317.
  10895. 11024. 11652.], 'meter')>,
 'T': <Quantity([ 1.485e+01  1.325e+01  1.075e+01  9.550e+00  8.850e+00  6.850e+00
   7.350e+00  4.350e+00  2.350e+00  5.000e-02 -4.500e-01 -4.750e+00
  -9.450e+00 -1.515e+01 -2.015e+01 -2.645e+01 -3.375e+01 -4.325e+01
  -5.145e+01 -5.715e+01 -6.095e+01 -6.195e+01 -5.845e+01], 'degree_Celsius')>,
 'Td': <Quantity([ 1.580e+00  1.290e+00  1.380e+00 -1.050e+00  6.000e-02 -1.621e+01
  -1.345e+01 -1.392e+01 -1.544e+01 -1.637e+01 -1.795e+01 -1.826e+01
  -2.478e+01 -2.652e+01 -3.330e+01 -4.003e+01 -4.773e+01 -5.463e+01
  -5.647e+01 -6.508e+01 -7.121e+01 -7.205e+01 -7.650e+01], 'degree_Celsius')>,
 'u': <Quantity([ 5.99102939  5.33746254  3.33868427  3.34518638 -6.77322757 -2.24763956
  -6.30252506 -0.62819094 -3.9860191  -0.96961499 -3.59758473  2.21285231
   4.9813145   5.23710976  2.97225484  0.87248742  0.43631016  0.76429898
  -4.20808711 -7.72542486 -0.90738691 -3.88292952 14.32675907], 'knot')>,
 'v': <Quantity([ -9.22537625  -8.21897157  -7.15983152  -6.03487598  -1.31658207
   -5.56310313 -11.37005619 -17.98903489  -8.95274548 -13.8661403
  -13.42636899 -15.74526229 -12.97676793 -18.26397222 -18.76607847
  -24.98477068 -24.99619238 -21.88665911 -26.56881636 -23.77641291
  -25.9841615  -27.62847912 -30.72383398], 'knot')>,
 'site_info': {'site-id': np.str_('SJC'),
  'site-name': 'Norman Y. Mineta San Jose International Airport',
  'site-lctn': 'United States',
  'site-latlon': [np.float64(37.36), np.float64(-121.93)],
  'site-elv': '62',
  'source': 'ACARS OBSERVED AIRCRAFT PROFILE',
  'model': 'no-model',
  'fcst-hour': 'no-fcst-hour',
  'run-time': ['none', 'none', 'none', 'none'],
  'valid-time': ['2024', '02', '28', '01:30']},
 'titles': {'top_title': 'ACARS AIRCRAFT OBSERVATION VERTICAL PROFILE',
  'left_title': 'VALID: 02-28-2024 01:30Z',
  'right_title': 'SJC - Norman Y. Mineta San Jose International Airport, United States | 37.36, -121.93    '}}
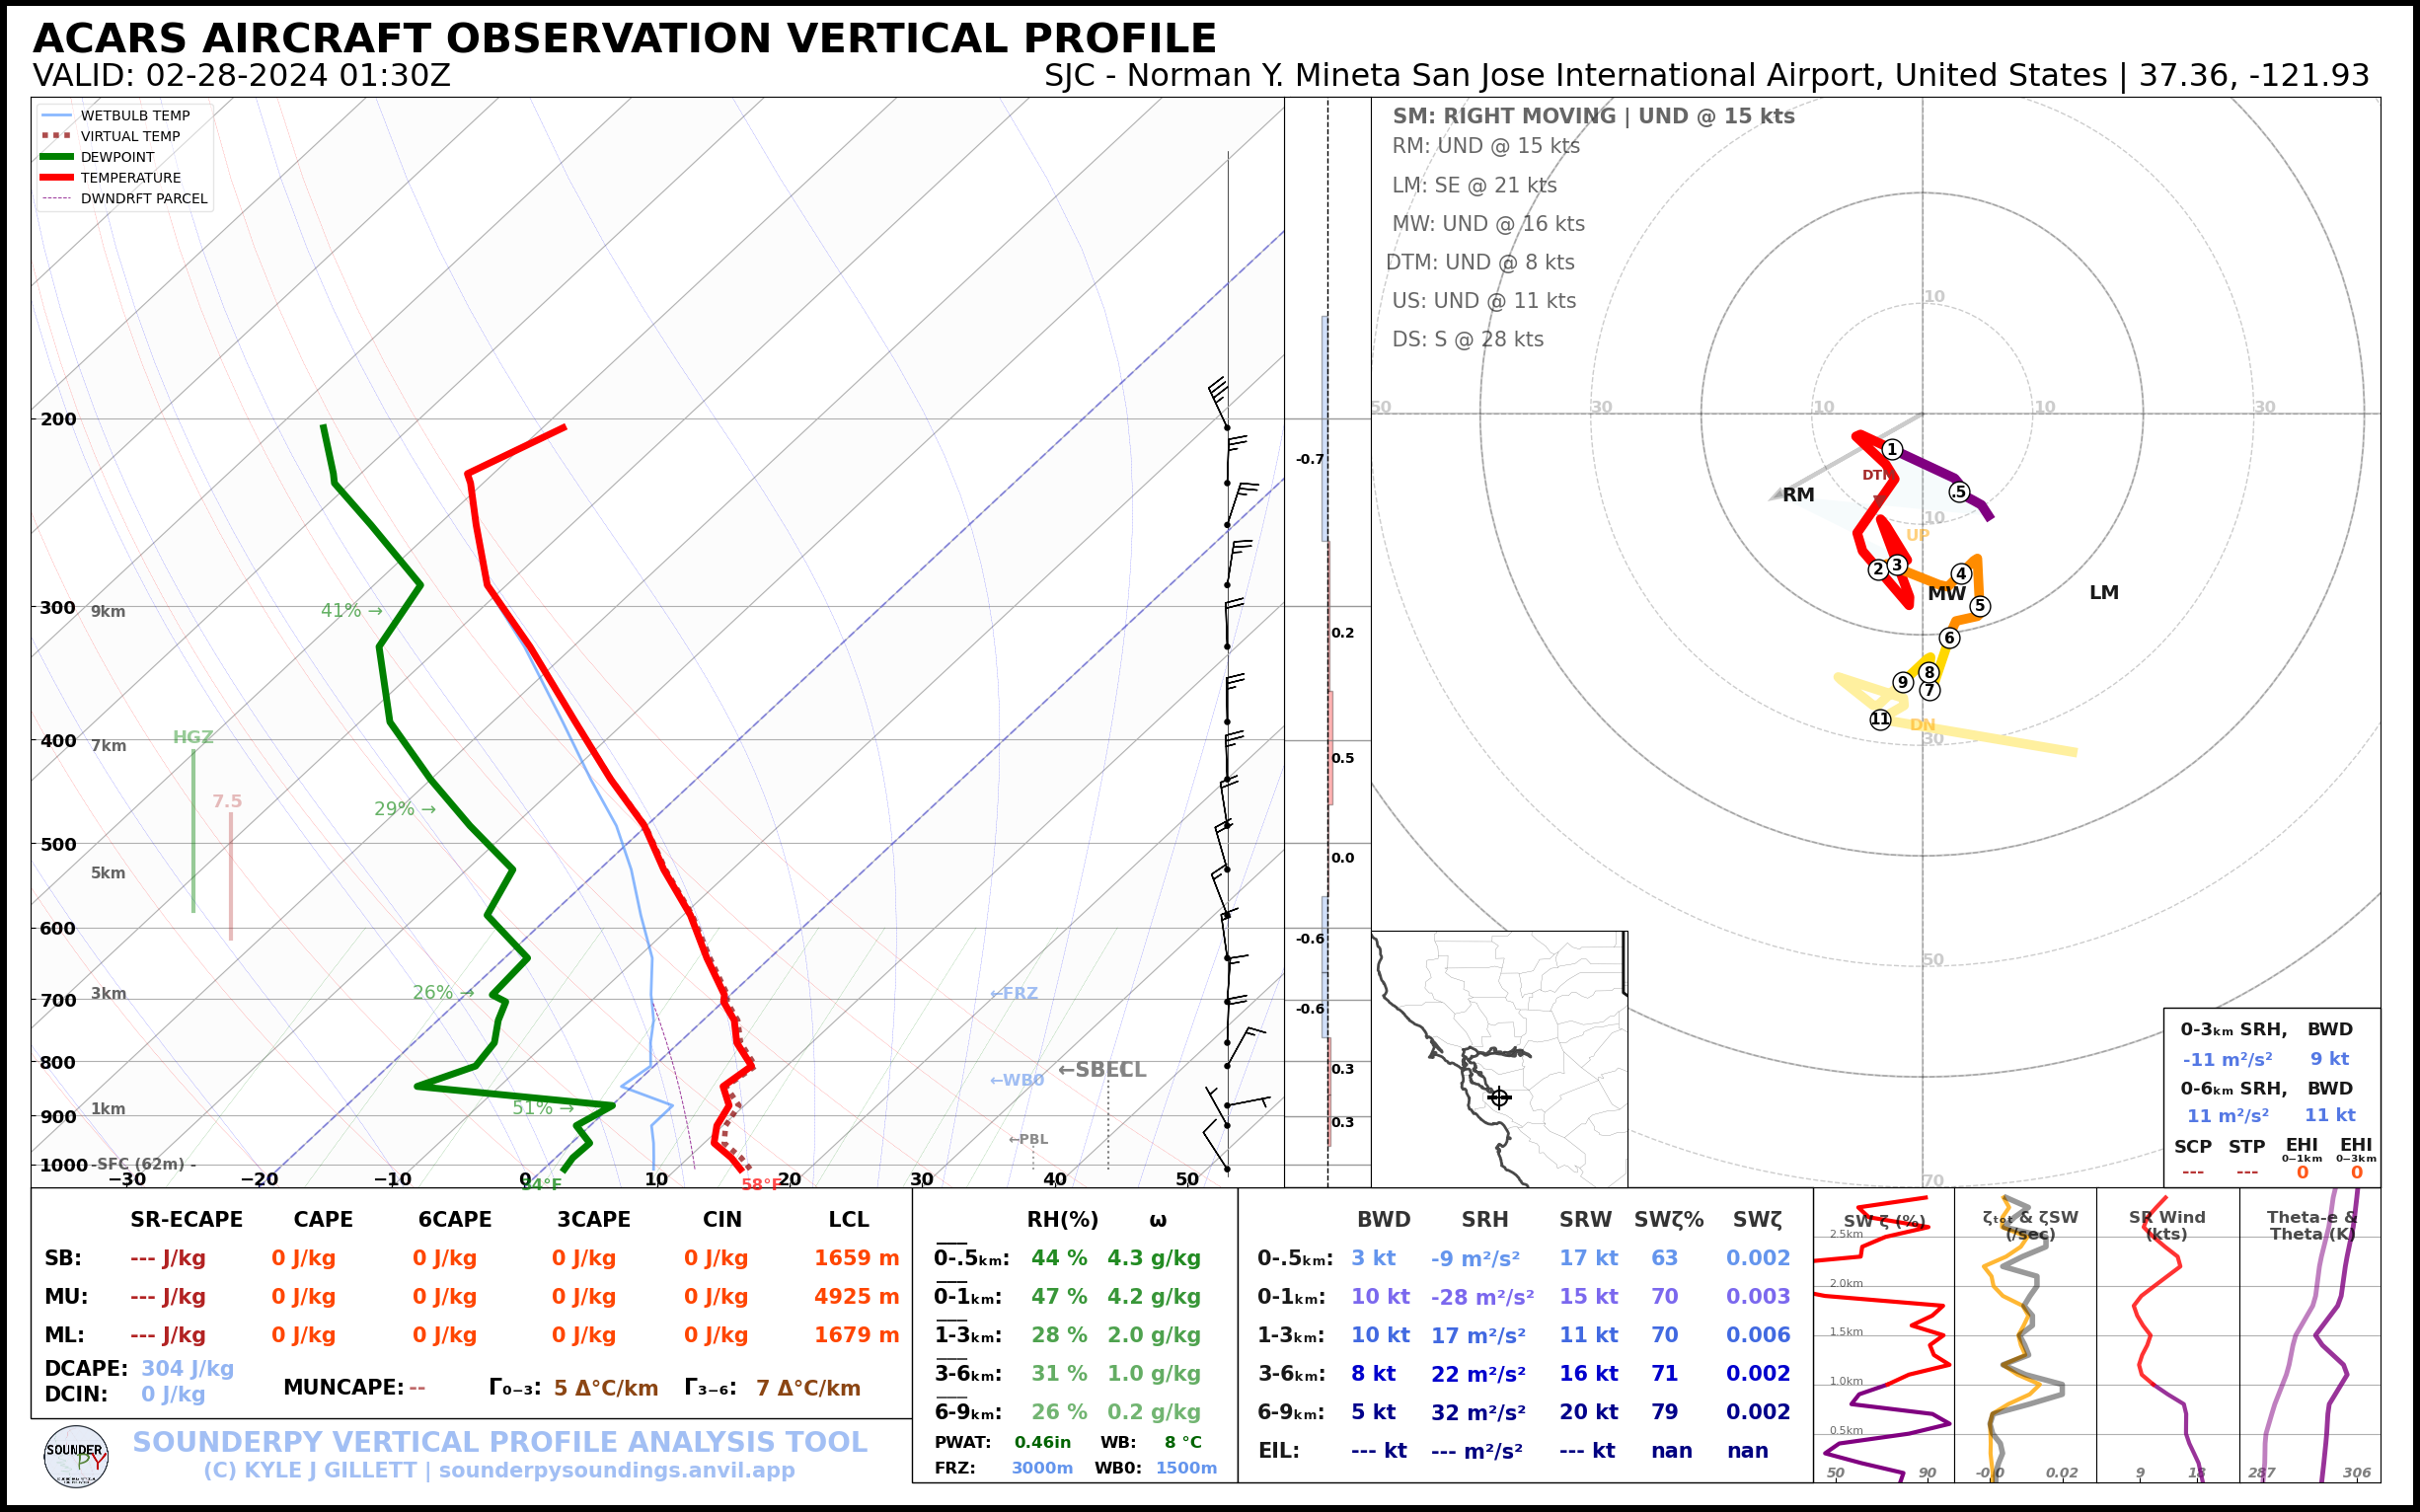
Build a plot of the data
[8]:
# lets make a sounding!
spy.build_sounding(clean_data)
> SOUNDING PLOTTER FUNCTION
  ---------------------------------
- no radar data available -
    > COMPLETE --------
    > RUNTIME: 00:00:01

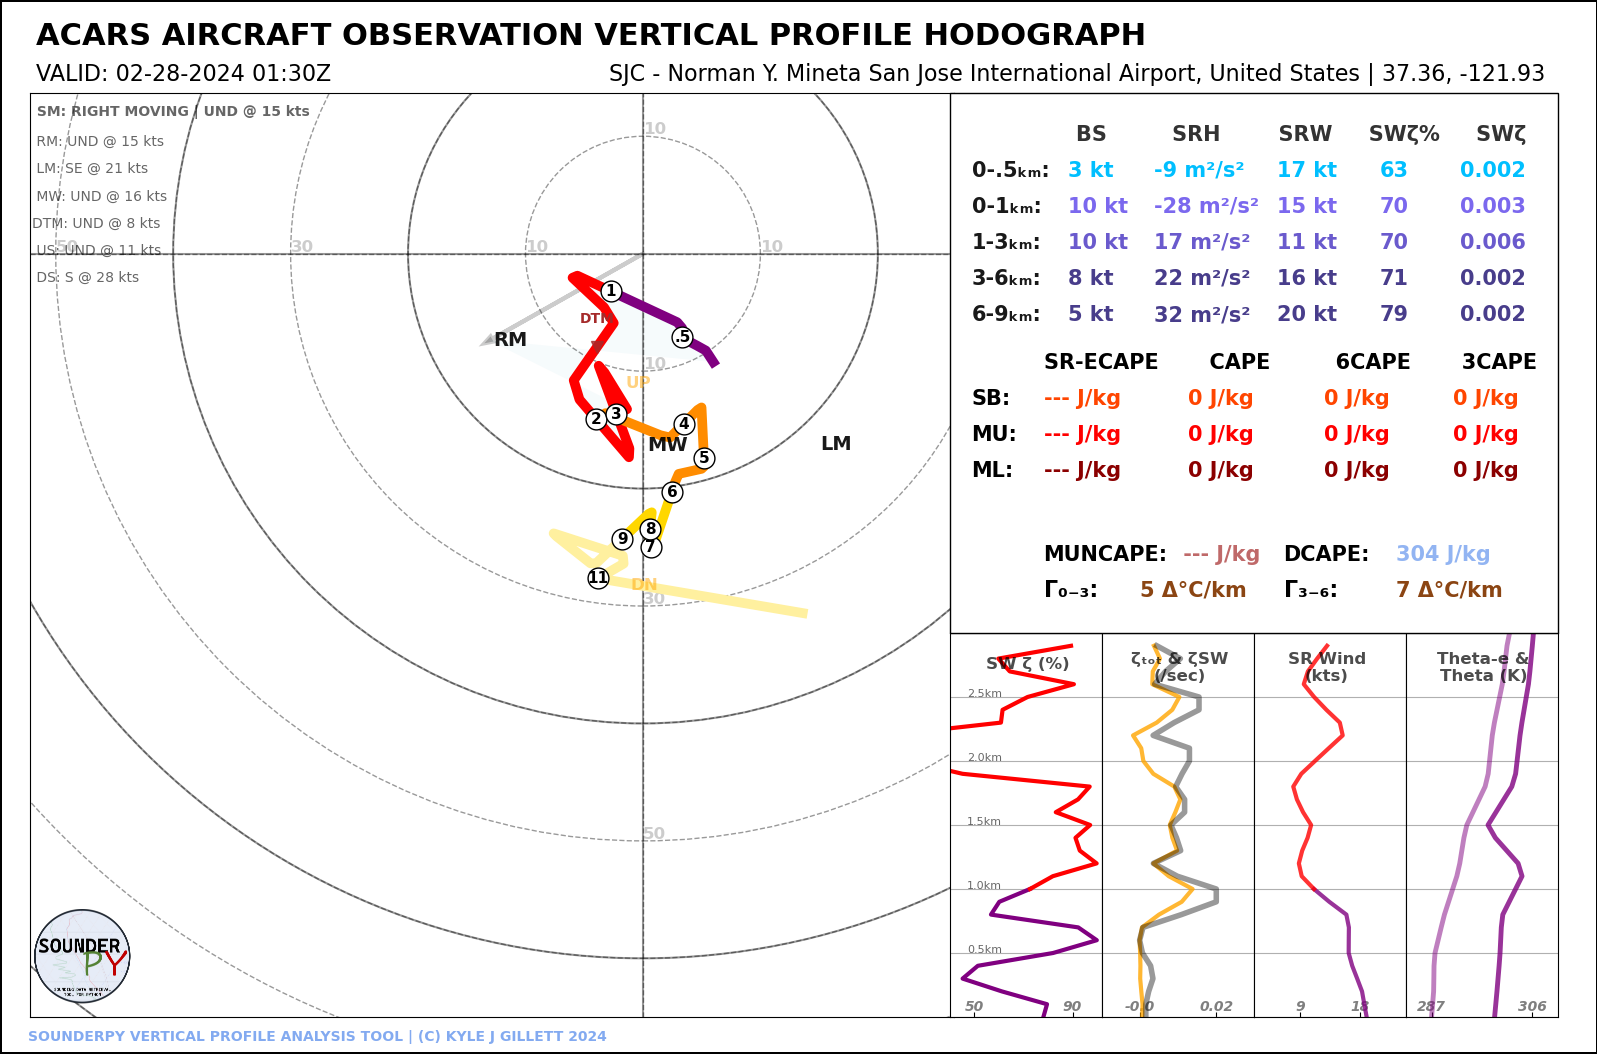
[9]:
spy.build_hodograph(clean_data)
> HODOGRAPH PLOTTER FUNCTION --
-------------------------------
> RUNTIME: 00:00:01

[ ]: